NEAR token sailing on windless waters after establishing this range

Disclaimer: The findings of the following analysis are the sole opinions of the writer and should not be considered investment advice
The price action of NEAR Protocol has formed a range in the past week, and at the time of writing, it had found some demand at the $10.5 area. Bitcoin also neared some resistance near the $39k area. A move higher for Bitcoin could likely take NEAR past the range highs as well. Buying volume has been steady but not significant enough yet to effect a reversal of the previous trend.
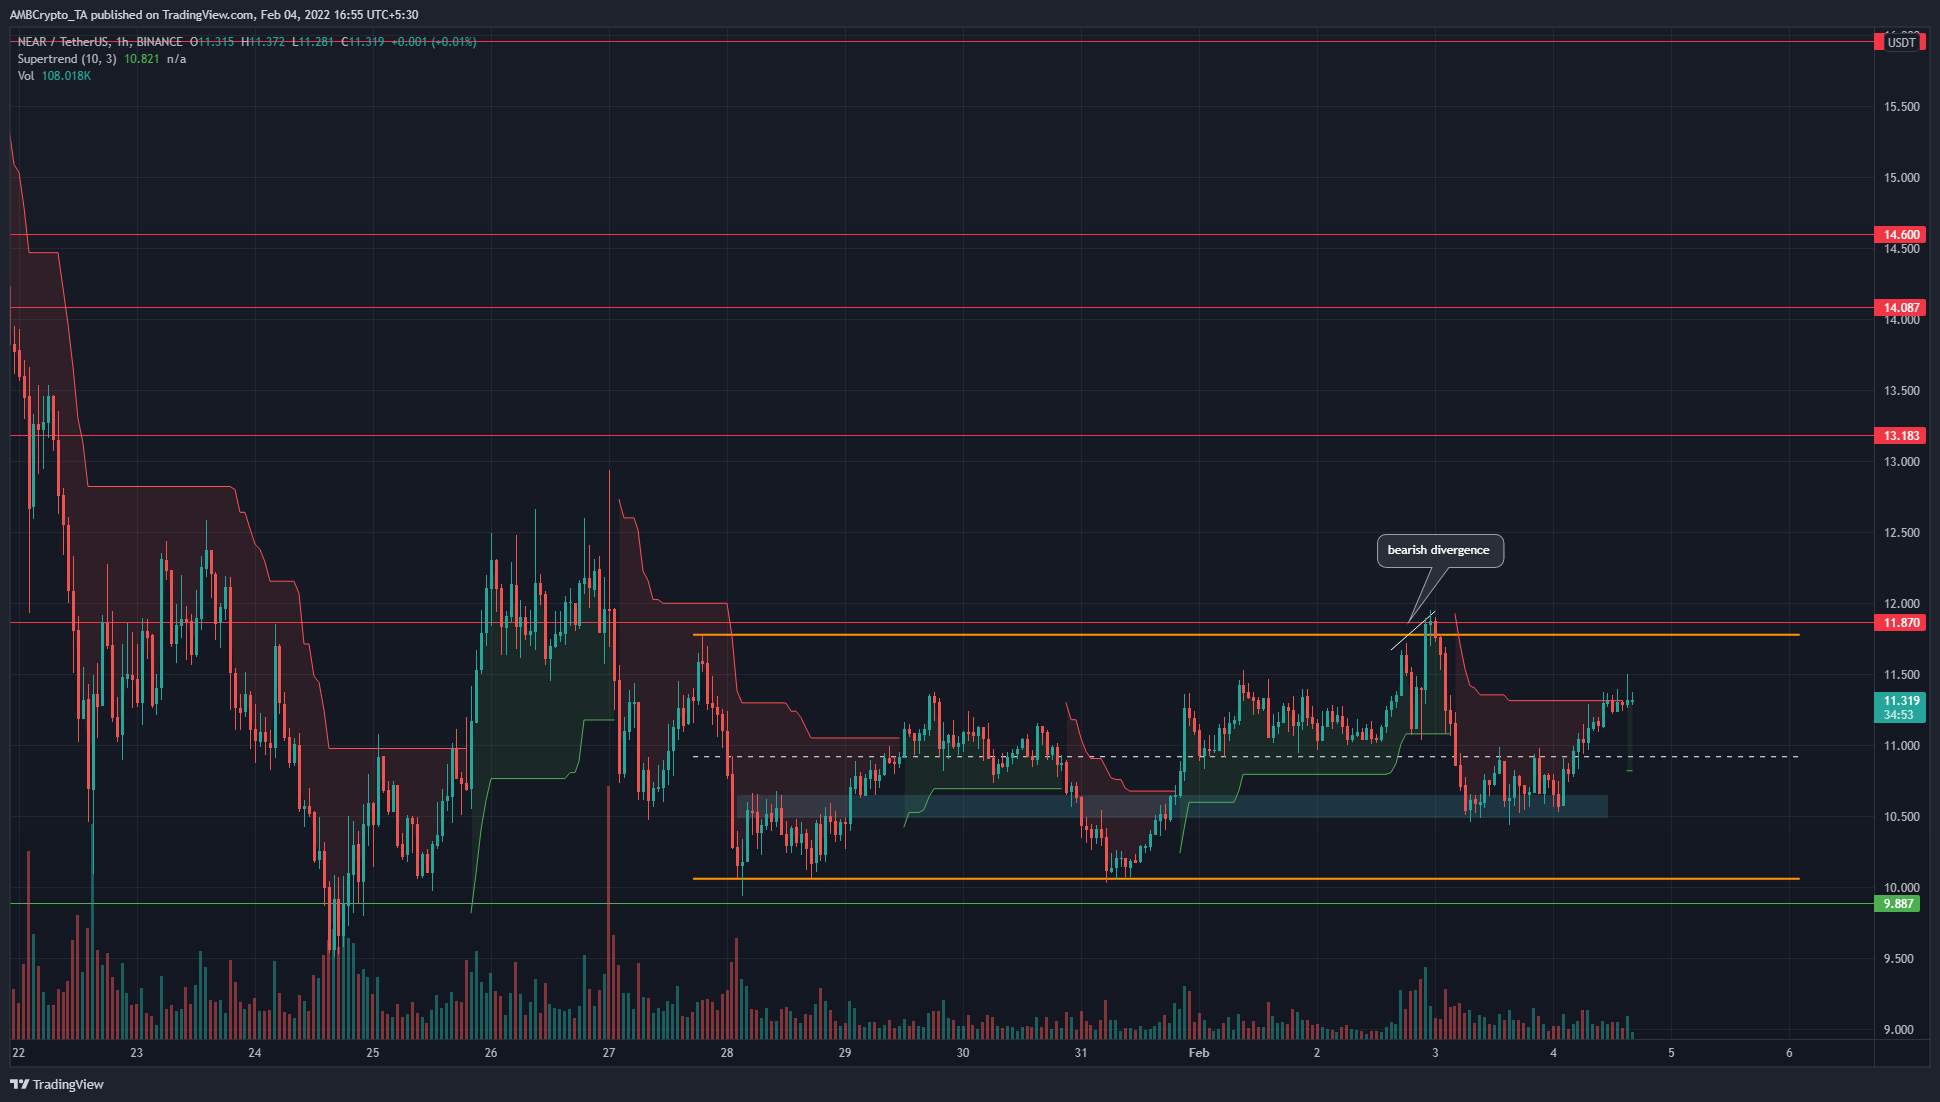
The $9.8 and $11.87 are levels of support and resistance respectively that have been significant multiple times in the past. At the time of writing, the price has been trading within a range between $10.05 to $11.77 over the past few days. It can also be seen that the mid-point of the range has been respected by the price. It represents the 50% level within the range, another significant level (in the near term).
When the price rose above the highs recently, a bearish divergence between price and momentum was seen. A previous area of supply has now been flipped to demand (cyan box).
Therefore the range lows and highs and the mid-point are the levels to watch out for NEAR. A move above or below the mid-point can flip bias within the range, while a breakout from the range will set a new bias for the next few days.
It is to be noted that even the $12.5 area has been swept in search of liquidity recently, so a bullish breakout from the range need not necessarily materialize into a move upward but could just turn out to be a trap.
Rationale
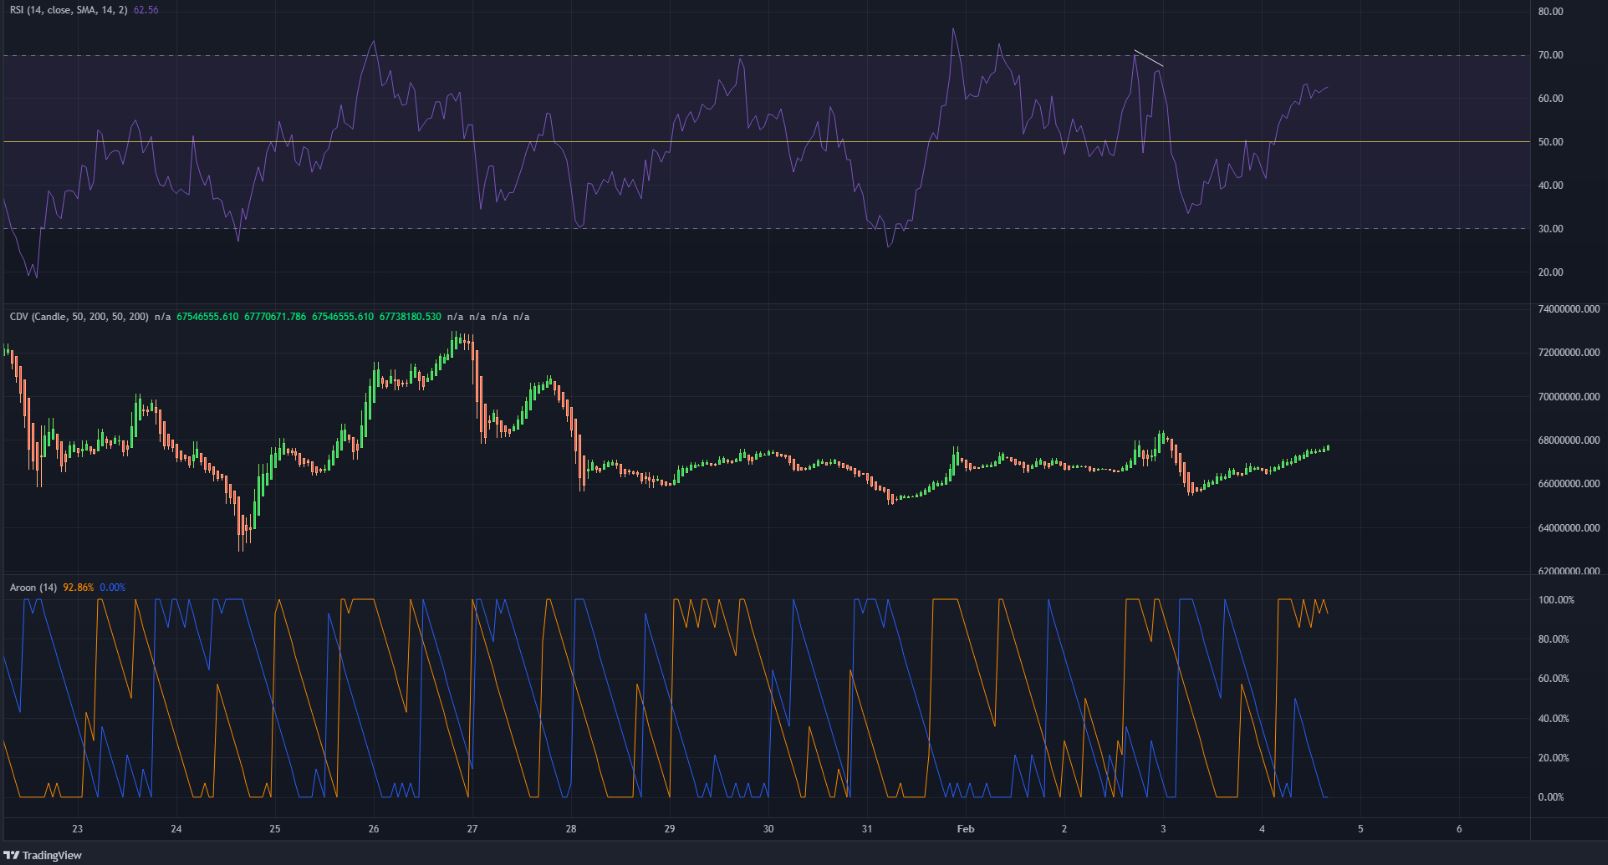
The RSI divergence at the range highs has already been mentioned. When trading within a range, the RSI regularly chops up the neutral 50 level, although this level is sometimes respected as support or resistance. The RSI highlighted how a prevailing trend has not been established.
The CDV also highlighted the same thing- buying and selling volume has more or less been equal within the range, so a breakout alongside a significant volume can turn out to be the beginning of a large move.
The Aroon Oscillator showed that there were periods of up and down trends within the range, but once again no dominant trend. The Supertrend’s sell signal was flipped to a buy signal.
Conclusion
The $10.05, $10.92, and $11.77 levels were the ones to watch out for in the hours or days to come for NEAR as they represent the range lows, mid-point, and highs.


