ONDO faces potential 17% drop – Is it time to buy the altcoin?
- If the head-and-shoulders pattern dominates ONDO, another 17% drop could be seen
- ONDO’s total addresses with balance over time reflected a steady hike
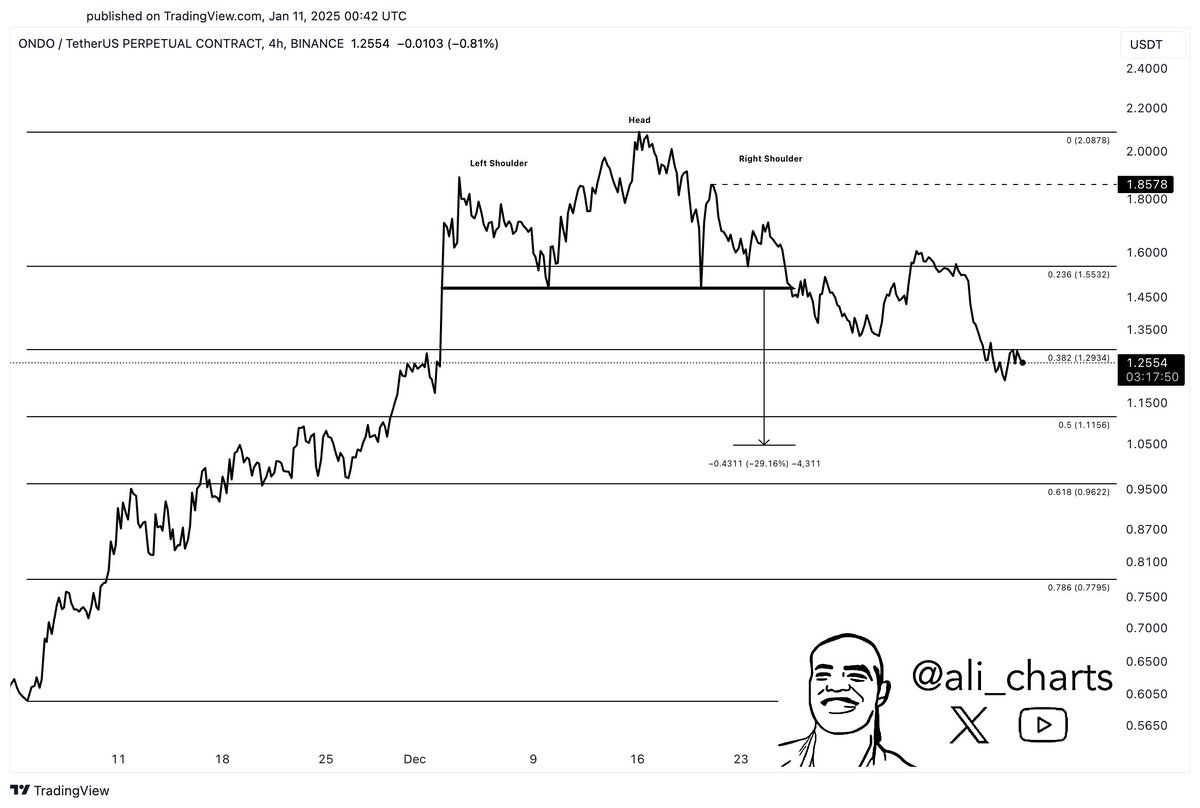
ONDO’s price action formed a head-and-shoulders pattern on the 4-hour time frame. The left shoulder peaked near $1.85, the head at $2.09, and the right shoulder failed to surpass $1.85, confirming the bearish formation.
This led to a breakdown below the neckline at $1.55 and, this could confirm the anticipated 29% drop towards the $1.15 Fibonacci retracement level.
If the bearish pattern persists, a further 17% decline could push ONDO towards $1.05, aligning with the 0.618 Fibonacci level. The $1.05 price level could present an opportune buying level as it’s among the best RWA projects with potential for gains.
Conversely, a reclaim of $1.55 as support could invalidate the bearish outlook and precipitate a potential recovery toward $1.85. This reversal would likely attract buyers, potentially targeting the $2.09 resistance zone.
The price previously respected Fibonacci levels, indicating traders’ adherence to technical setups. Both outcomes heavily depended on momentum and broader market conditions, emphasizing the pattern’s critical role in ONDO’s next move.
ONDO on-chain analysis show…
Tracing ONDO’s total addresses with balance over time reflected a steady hike, signaling growing holder confidence despite a volatile price path. This pointed to an accumulation trend, even as the price faces declines on the chart.
Historically, a hike in addresses with balance has often preceded stability or upticks in ONDO’s price – Indicating a potential buffer against the threatened 17% drop.
If the trend persists, ONDO might stabilize or recover quicker than anticipated. Conversely, should addresses with balance decline sharply, it could exacerbate the price drop, confirming the bearish forecast.
Additionally, the average holding time for ONDO transactions indicated fluctuating investor behavior against the backdrop of price movements. The peaks in holding time from mid-2023 into 2024 coincided with periods of price stability or hikes.
However, the marked shortening of holding times towards the end of 2024 seemed to align with periods of price declines – Suggesting a hike in selling pressure.
This recent trend of reduced holding times could signal heightened risk of a further price drop. If historical patterns hold, extended periods of shorter average holding times often precede price drops.
Conversely, an increase in holding times could indicate potential for price stabilization or recovery, essential for offsetting the projected 17% drop.
Social activity
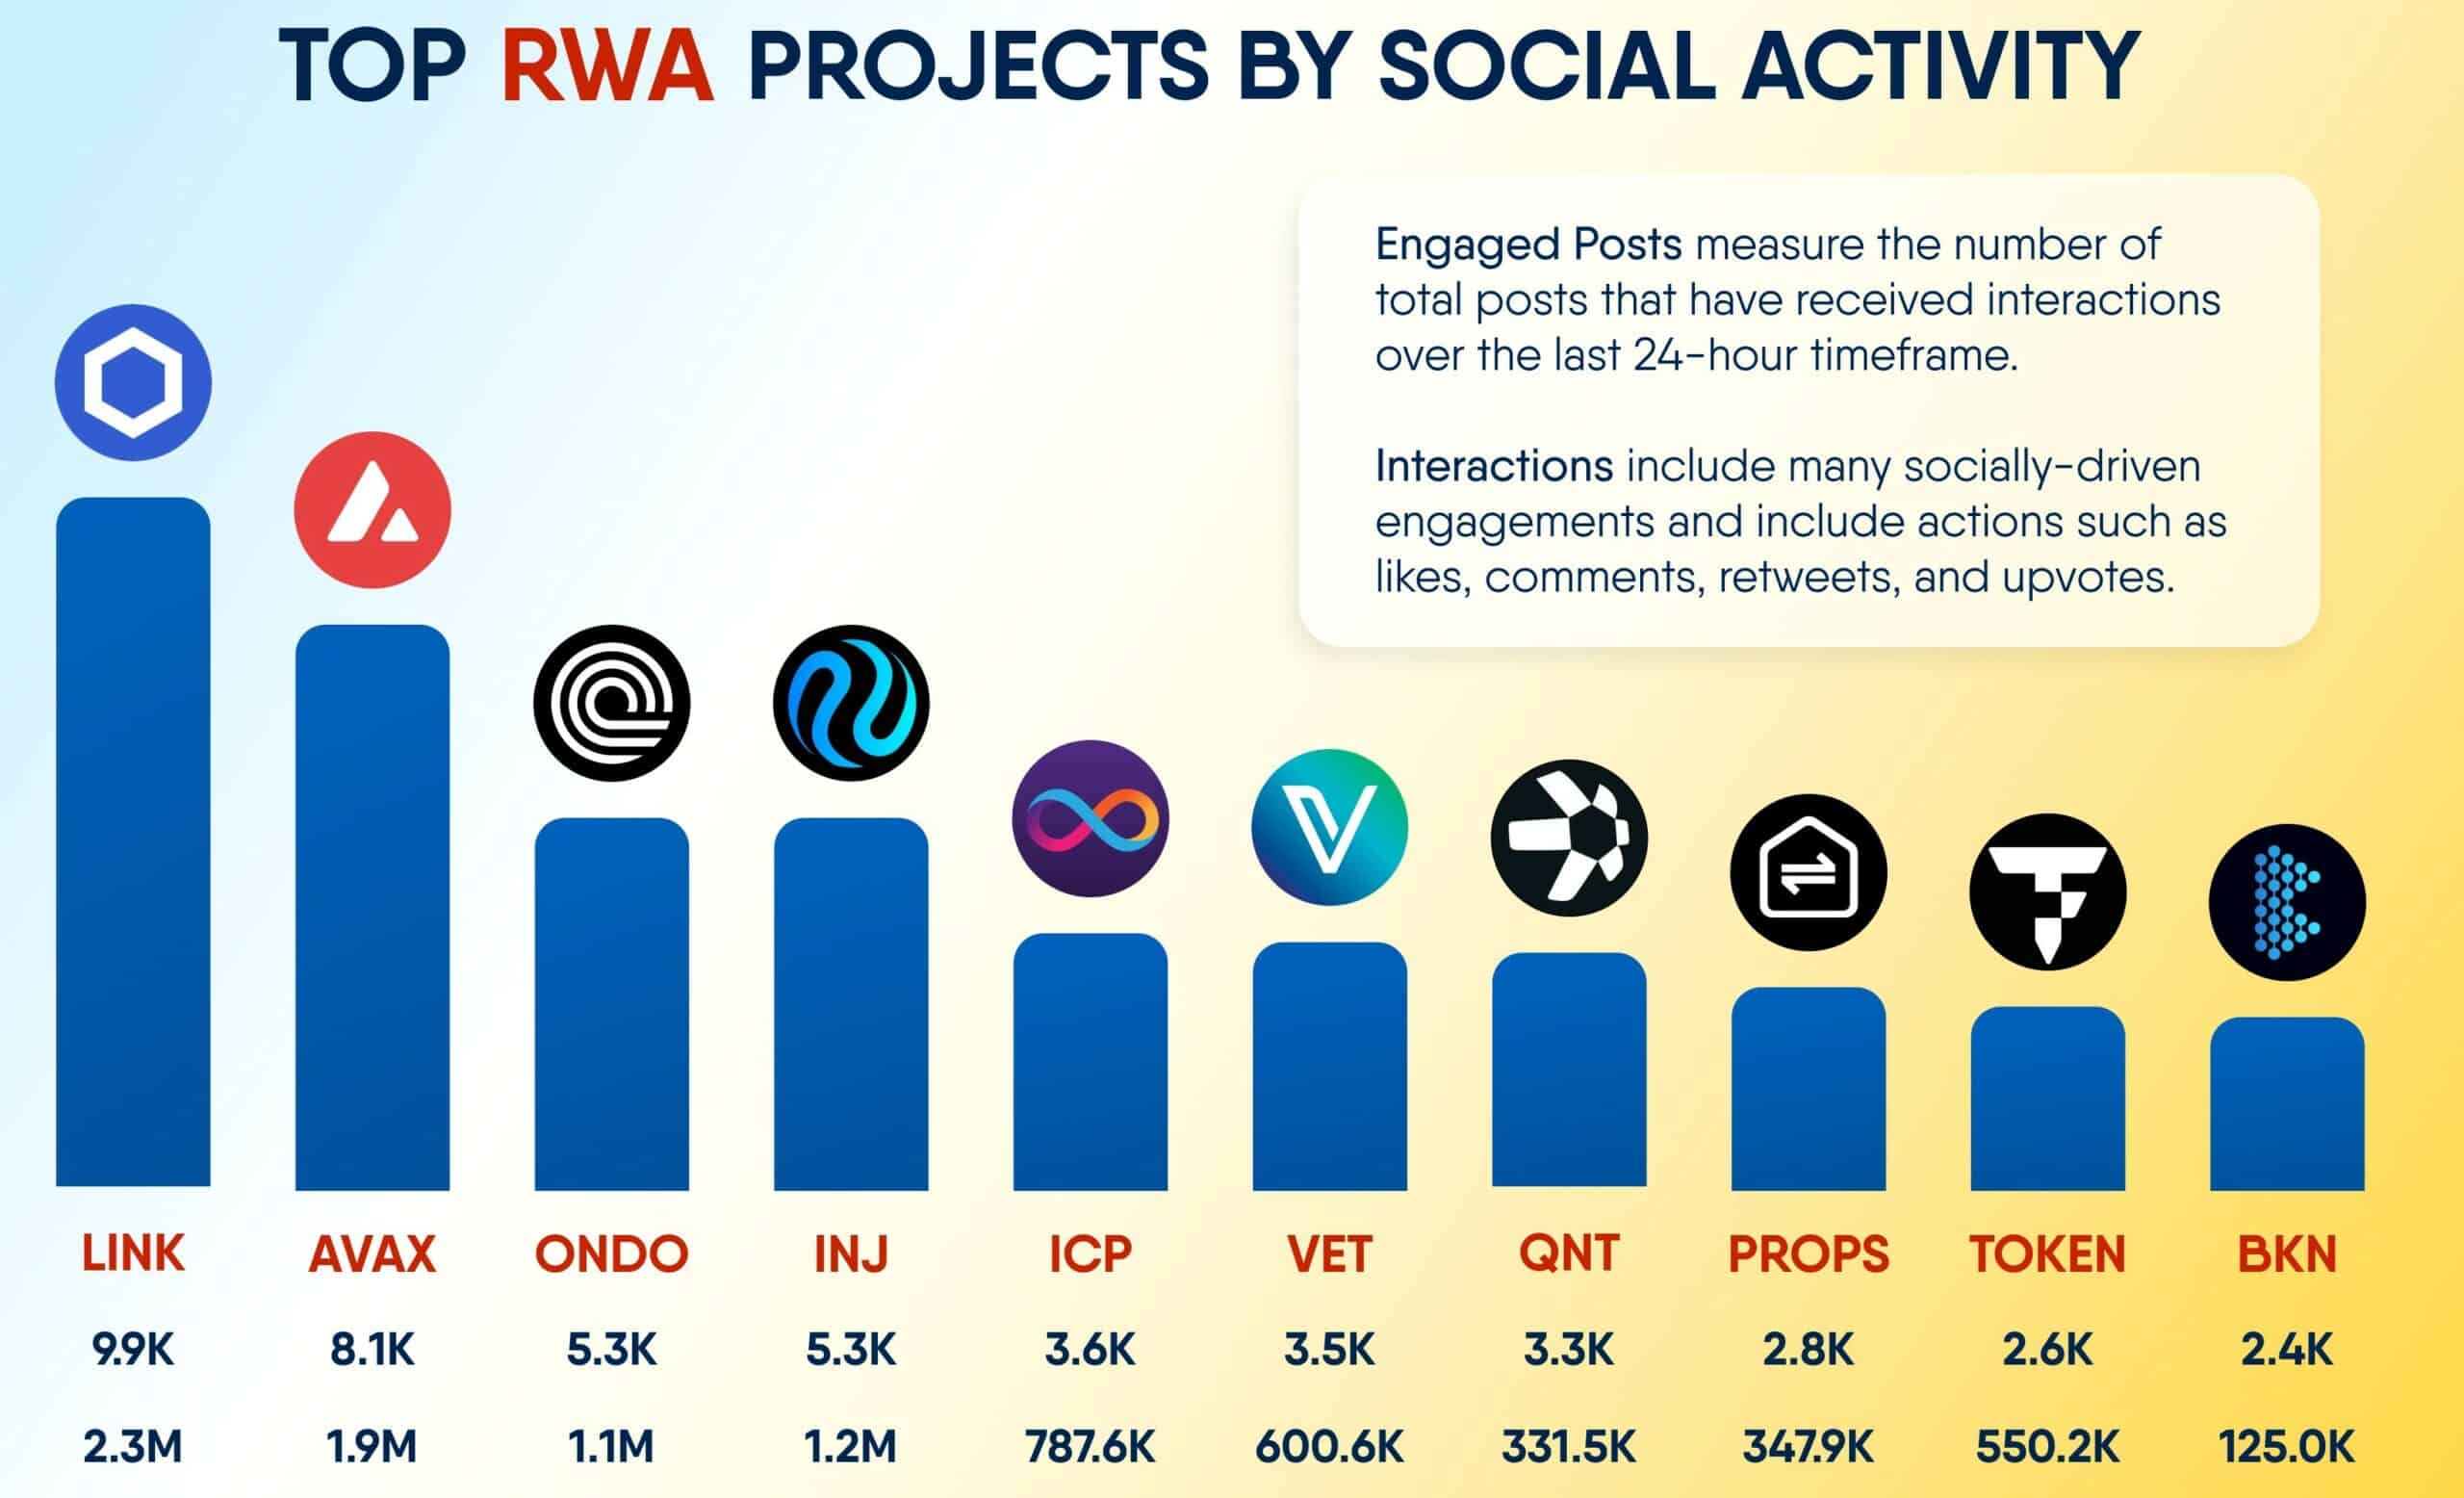
ONDO still remains a top contender, securely holding the third position with engaged posts at 5.3k and interactions tallying 1.1 million.
The social traction for ONDO, despite potential price drops, could allude to resilience and enduring investor interest, potentially stabilizing or even reversing the forecasted 17% price fall.
This enduring social presence might signal underlying strength, making ONDO a critical watch in the evolving crypto landscape.

