- PancakeSwap has shed 11% from the previous day’s local high.
- Another price drop of up to 7% could commence in the coming hours.
PancakeSwap [CAKE] bulls were unable to defend the $2.55 support, but they have done well over the past two weeks to drive prices higher. The strong gains made on the 17th of March left a fair value gap on the 1-day chart.
Clues from this FVG, the range formation, and the liquidation heatmaps outlined support levels where a bullish reversal could ensue.
PancakeSwap has a bullish outlook, but…
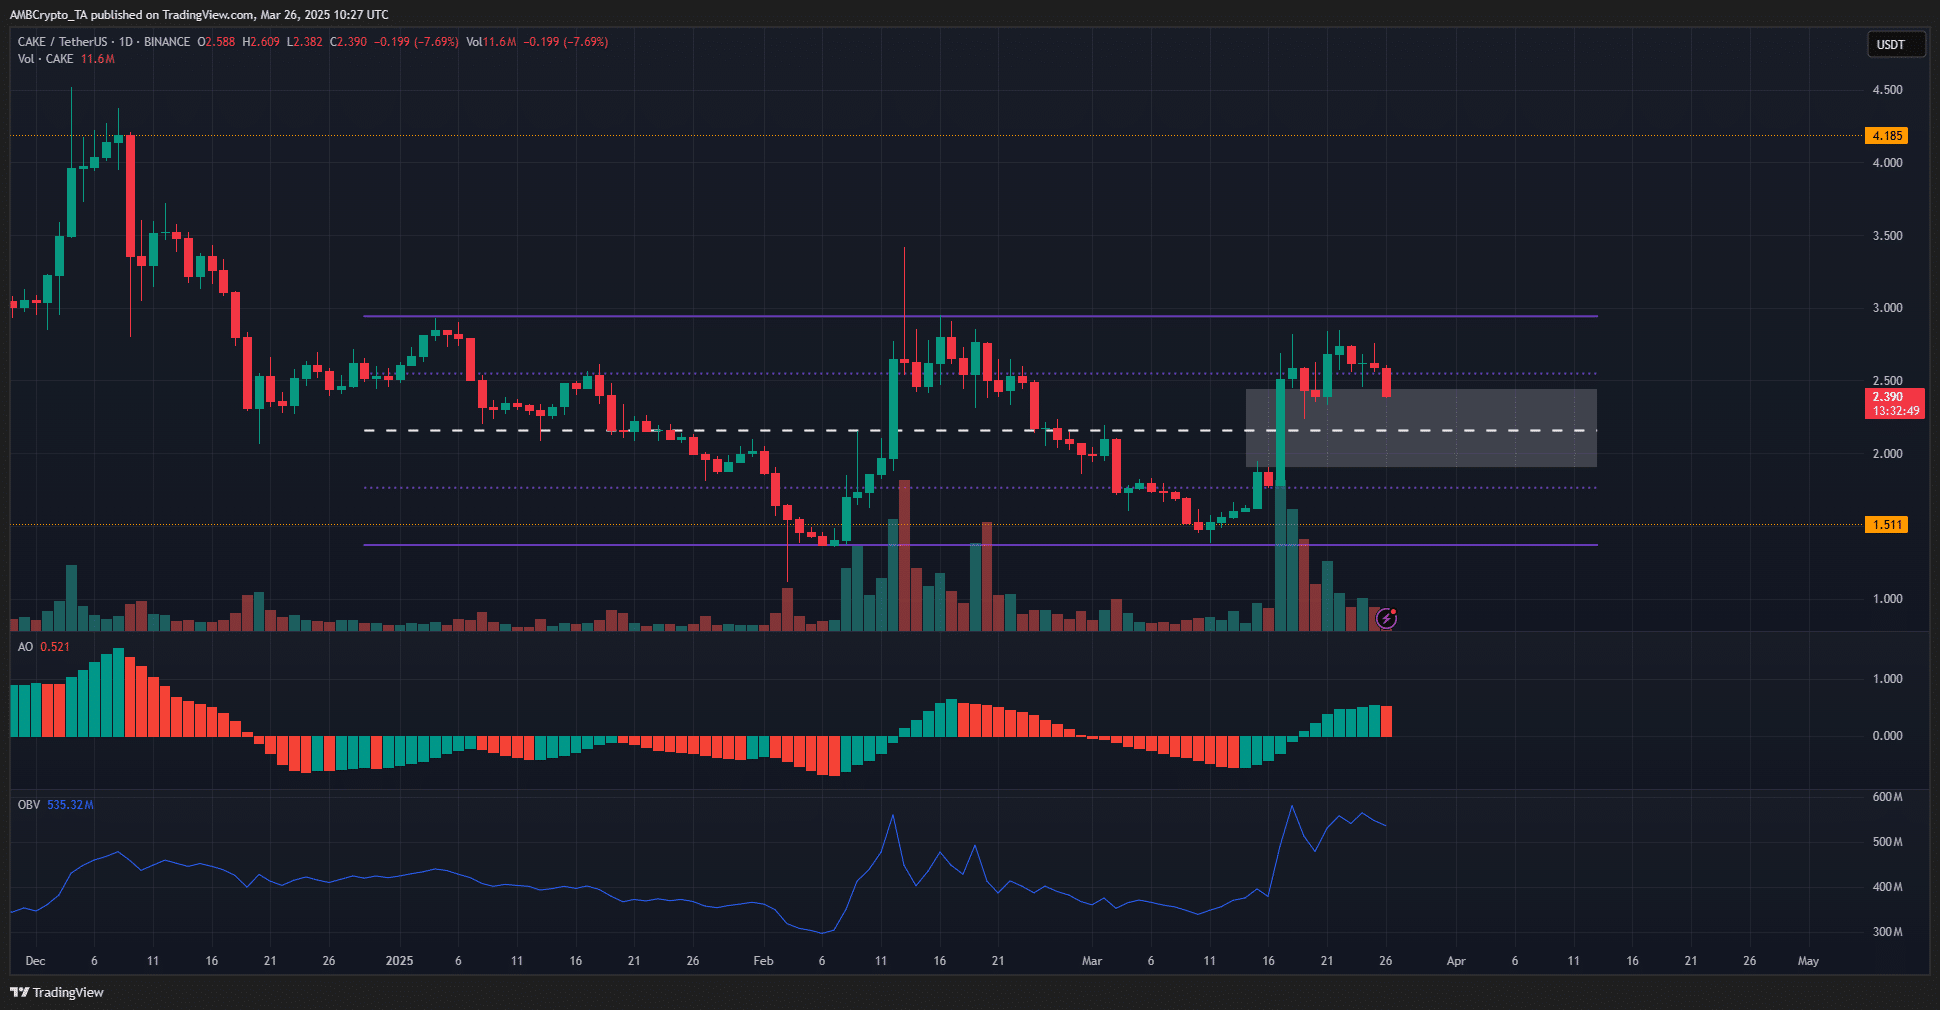
Source: CAKE/USDT on TradingView
PancakeSwap has been trading within a range formation since early 2025. It was highlighted in purple and extended from $1.37 to $2.94, with the mid-range level at $2.16.
The strong price move on the 17th of March, alongside the highest daily trading volume in four months, was being retraced at press time.
It was expected that CAKE would test the $2.94 range highs and possibly the round number resistance at $3. However, the bears forced a rejection at $2.85 over the weekend.
The price move also left behind a sizable fair value gap, outlined in white. In the coming days, with the drop below the $2.55 support, a move to the mid-range support at $2.16 was highly likely.
The OBV has been in a strong uptrend over the past two weeks, climbing above the February highs. The Awesome Oscillator also underlined firm upward momentum. Hence, it was likely that the current retracement would not extend below $2.16.
Levels to watch out for
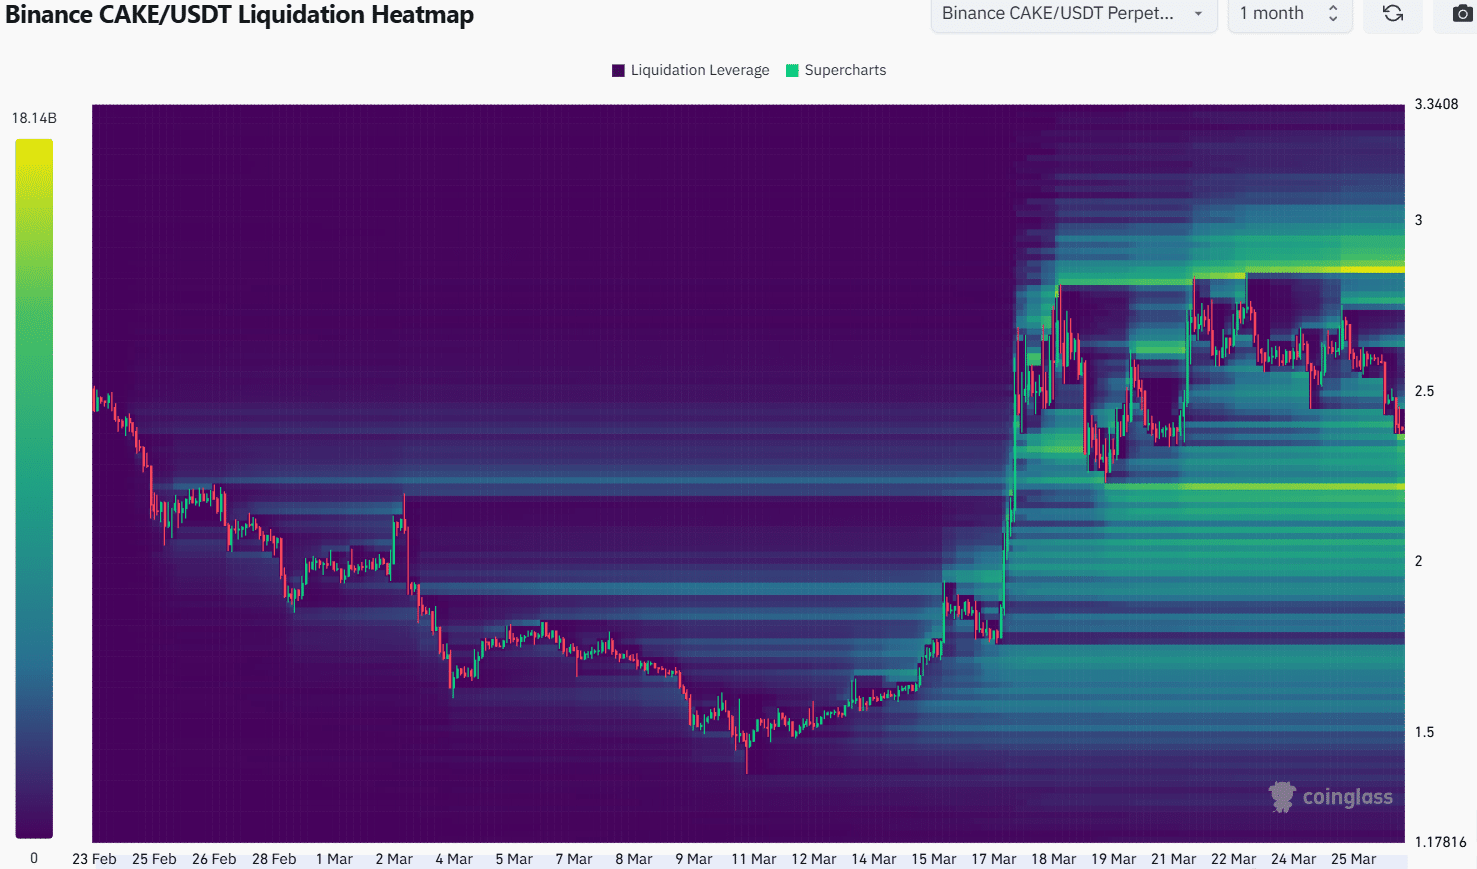
Source: Coinglass
The 1-month liquidation heatmap reflected the short-term range that CAKE had formed between the $2.22 and $2.84 levels within the aforementioned 3-month range. The heatmap showed a cluster of liquidity at $2.36, just below the current market price.
Another liquidity pocket at $2.22 was also visible on the heatmap. Therefore, these were the levels where a bullish reversal could ensue. The $2.22 level represented last week’s lows, but the mid-range level was a valid short-term price target based on the price action.
Therefore, traders looking to go long on CAKE should watch the token’s reaction at the $2.22 and $2.15 levels.
A surge in bullish momentum and trading volume spikes on the lower timeframe charts after a CAKE retest of these support levels would imply a bullish reversal in progress.
Disclaimer: The information presented does not constitute financial, investment, trading, or other types of advice and is solely the writer’s opinion