PEPE Price Prediction: How short-traders can profit after a tepid performance
The sentiment across the market was not positive overall. Many altcoins are trading at important support zones, but a move higher was not guaranteed, and this was true for PEPE as well.

Disclaimer: The information presented does not constitute financial, investment, trading, or other types of advice and is solely the writer’s opinion.
- PEPE traded within a range but the buyers could be overwhelmed by a wave of selling pressure if BTC falls
- Short-sellers can wait for a retest of former support zones to look for selling opportunities in case of a move downward
Bitcoin [BTC] has traded within a range that reached from $29.8k to $31.5k. Over the past week, the prices have been at the range lows, which did not bode well for bullish traders. This could have a significant impact on Pepe [PEPE] as well.
Read Pepe’s [PEPE] Price Prediction 2023-24
PEPE’s price action was also confined to a range formation over the past month. Traders must decide if the retest of the support levels highlighted was worth the risk. The on-chain metrics and price action suggested buyers were weak- will this force a breakout beneath the range? Here is a PEPE Price Prediction that explores the various scenarios that are likely to unfold in the coming months.
PEPE is stuck within a range as age consumed begins to drop
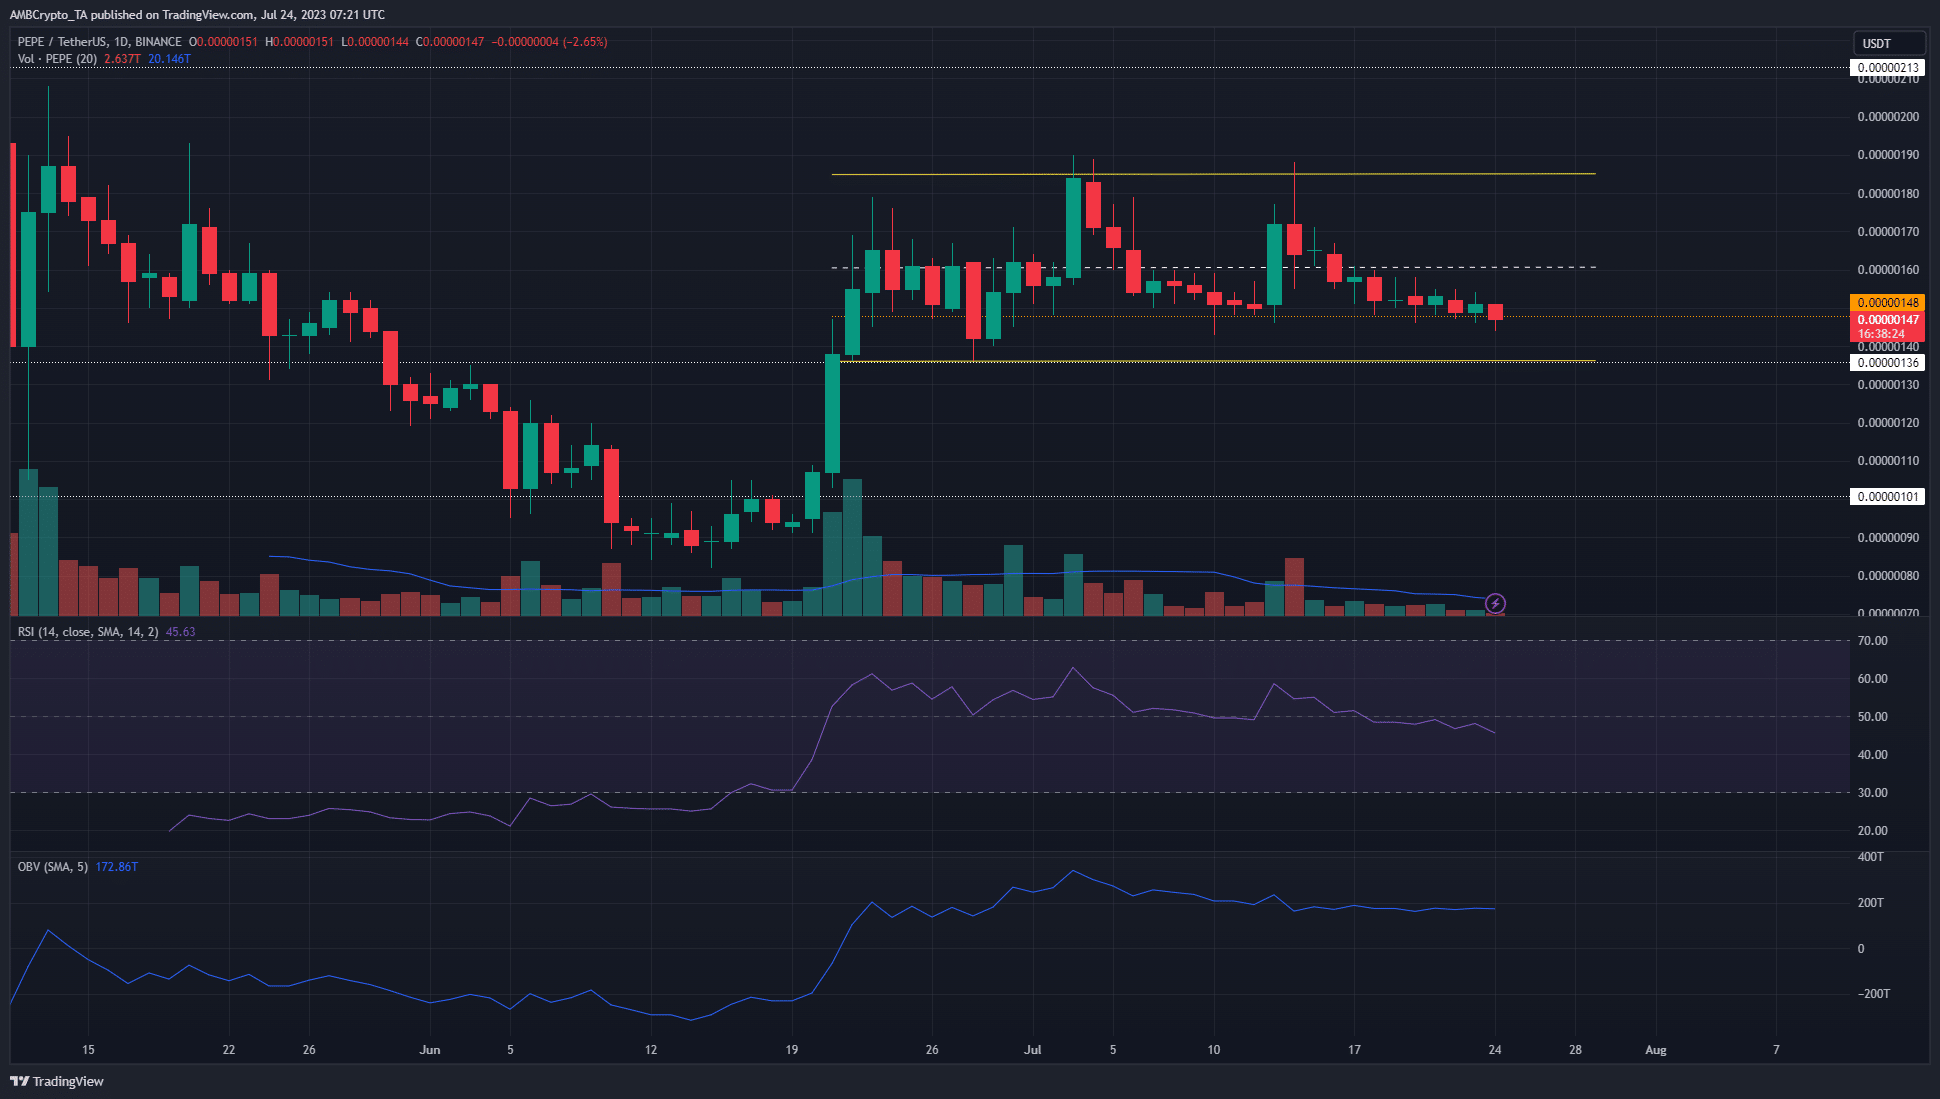
The 1-day price chart showed that PEPE traded within a range that extended from $0.00000136 to $0.00000185. From the range low to the high it measured a near 36% difference, which suggested a lot of volatility was present in the time PEPE was within the range.
This volatility was more visible on the lower timeframe charts. Focusing on the daily chart, we can see that trading volume has begun to dry up as July progressed. Moreover, the market structure was bearish and the bulls were unable to defend the mid-range support at $0.0000016.
The support level at $0.00000148 (dotted orange) has been important since late June, but at the time of writing the prices have begun to dip beneath this level. The RSI fell below neutral 50 on 18 July which could have been an early signal that the bears were growing in strength. The OBV also slid lower in July, highlighting a lack of buying pressure.
PEPE can be bought at the $0.00000148 and $0.00000136 support levels targeting the range high at $0.00000185. However, traders must be prepared for a slump beneath the range lows as well.

The exchange inflow and outflow saw some incongruence on 14 July, with more outflows than inflows. In the days since then, exchange flow did not favor either side strongly. The 30-day MVRV ratio has been in a downtrend in July. Its negative values at press time showed an undervalued asset.
This does not mean prices will rally immediately. The active addresses have begun to drop over the past few days, which suggested demand could slow down as well. It would be hard for bulls to drive a rally without participation from users.
The age consumed metric saw sharp spikes around the 14 July which suggested a large wave of selling was underway. Since then, this metric did not see noticeable upward surges, which suggested selling pressure was not peaking in the short-term yet.
PEPE prices were in a downtrend on the lower timeframes, but will this result in a breakout beneath the range?

The price action has had a bearish bias since 17 July on the H4 chart. The momentum and selling pressure have also been on the bearish side over the past week. PEPE made a series of lower highs after falling below the mid-range support at $0.0000016. At the time of writing, it was on the verge of losing the $0.00000148 support as well, and trading volume was low over the past week.
Yet, the price was at a place that saw PEPE bounce to the range highs on 12 July. Therefore, the recent losses represented what could be a low-risk buying opportunity for bulls. Even though it is a contrarian trade, the reward outweighed the risk.
The next 12-24 hours could establish whether Pepe prices would recover or slump further
When trading a range, it is usually better to expect that the range will continue, than to anticipate a breakout each time the price approached the extremes. Hence, the argument behind buying PEPE is simple- it is near the low. If the buyers are unable to force a reaction this week, then the case of a move beneath the range lows can be anticipated.
In such a scenario, a retest of the $0.00000136 area as resistance will offer a short-selling opportunity targeting the next higher timeframe support at $0.000001.

The 2-hour chart from Coinalyze showed that since 17 July the Open Interest was relatively flat. After 21 July, PEPE prices slowly fell lower and lower, and the OI accompanied the prices downward. This highlighted bearish sentiment and discouraged longs.
The funding rate remained positive but began to drop in recent hours. While it showed positive sentiment, overall, the OI gave a clearer picture of speculator sentiment.
Realistic or not, here’s PEPE’s market cap in BTC’s terms
The sentiment across the market was not positive overall. Many altcoins are trading at important support zones, but a move higher was not guaranteed. With Bitcoin bulls unable to drive a move back toward $31.5k over the past week, it appeared that the bulls were nearing exhaustion and could soon be overrun.
Further losses for PEPE will likely see the meme coin fall toward the $0.000001 support level. This was where the previous rally began in mid-June, and prices could slump there in search of buyers.


