Analysis

Polkadot, Binance Coin, Bitcoin Cash, Bitcoin SV Price Analysis: 28 April
Posted:
editor-in-chief

Thanks to the correlation the market’s alts share with Bitcoin, the former followed suit when BTC depreciated on the price charts. What such a correlation also meant, however, was that when the king coin went on a recovery run, so did many alts, including the likes of Polkadot, Binance Coin, Bitcoin Cash, and Bitcoin SV.
Polkadot [DOT]
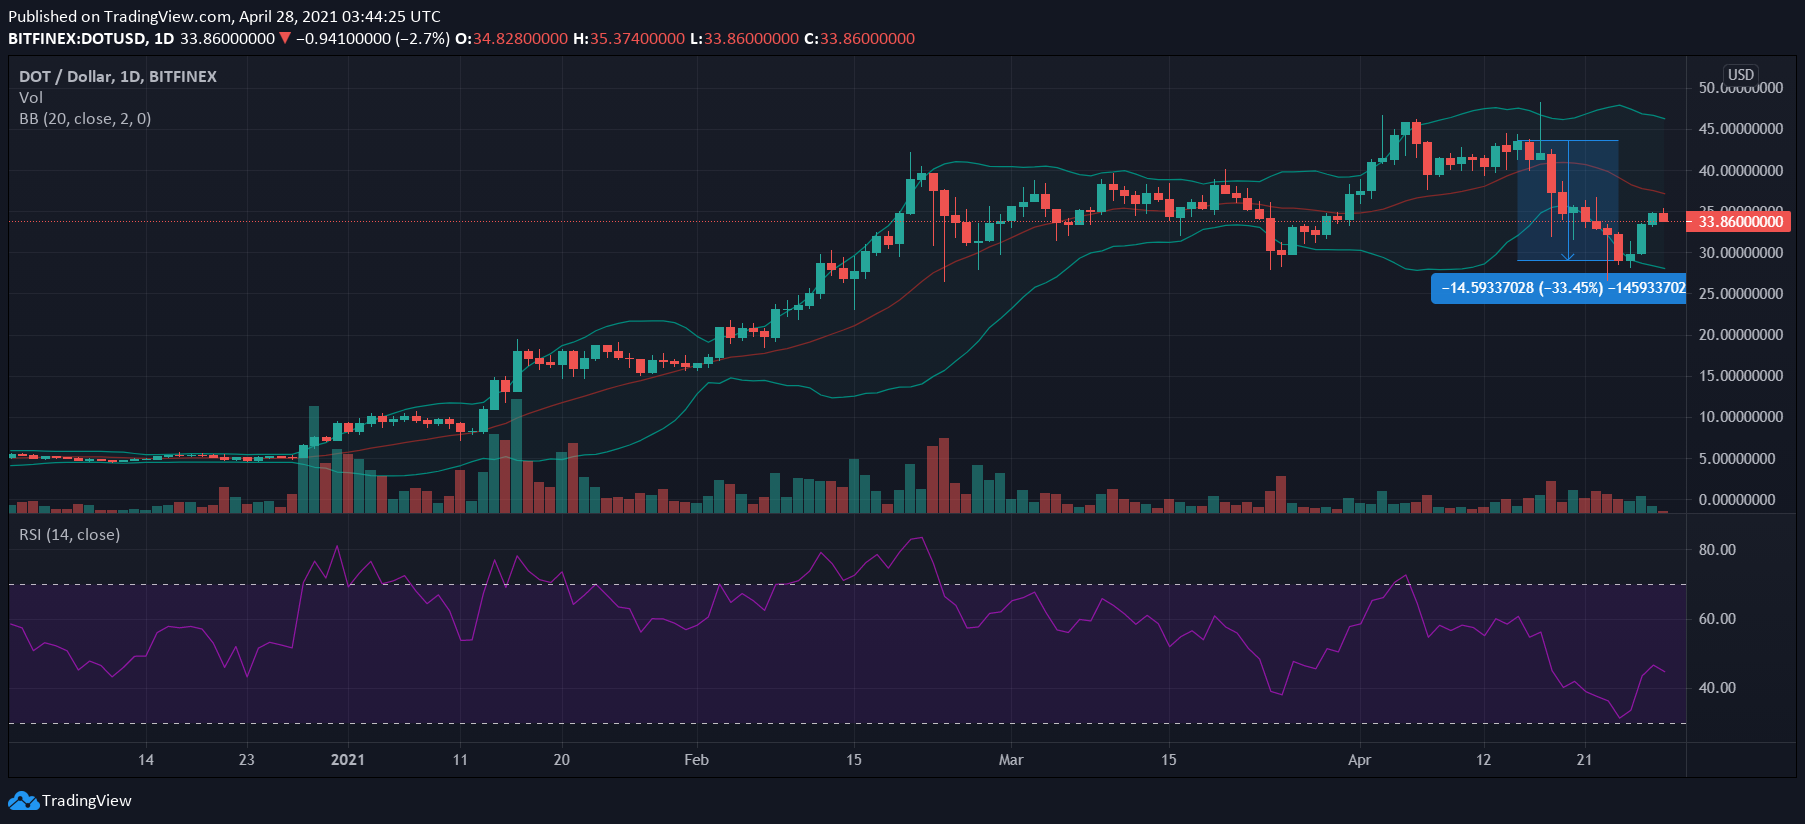
Source: DOT/USD on TradingView
Polkadot, the crypto ranked 8th on CoinMarketCap, was trading around its ATH levels of $47.63 before corrections pulled the value of the alt south. In fact, following the most recent series of corrections, DOT fell by over 33% on the charts. Since then, however, corresponding to the wider market’s bullishness, DOT, at press time, had regained some of its previous losses.
Whether this brief uptrend can be sustained for another breach of a previous ATH is a question for another time.
The widening mouth of Bollinger Bands suggested that some price volatility might be incoming in the near term. Further, on the back of the bullish price action over the past few days, Relative Strength Index was moving to attain a degree of equilibrium between the oversold and overbought zones.
DOT’s press time price action also invalidated the projections made by a recent price analysis.
Binance Coin [BNB]
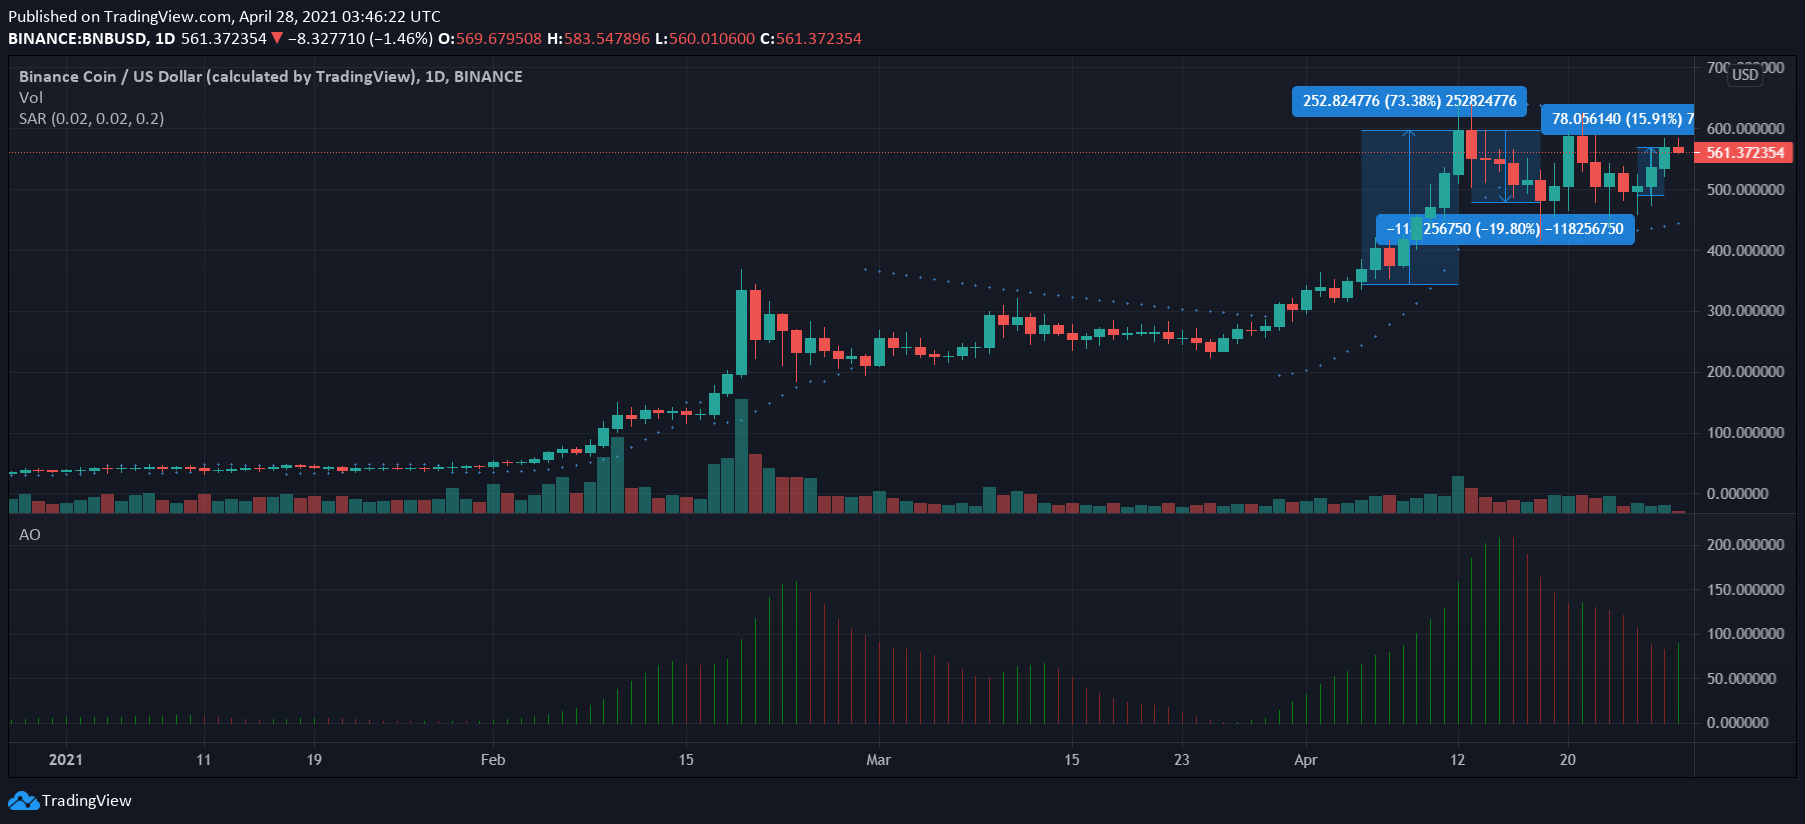
Source: BNB/USD on TradingView
Like most alts, BNB’s bull run was also halted in its tracks by the Bitcoin-led market depreciation. As the crypto-market’s biggest exchange token, however, Binance Coin was quick to recover on the charts, despite the fact that its price action was very inconsistent. Even so, BNB, at press time, was close to its ATH levels, with the market’s ongoing bullishness likely to keep pushing the altcoin up the charts.
While Parabolic SAR’s dotted markers were under the price candles and underlined the aforementioned bullishness, Awesome Oscillator’s histogram flashed a combination of bullish and bearish signals, despite the market momentum being positive.
It should be noted, however, that trade volume has remained consistently average of late.
As predicted, BNB’s value failed to hit its strong support level at $300, with the alt now prepping for a bullish leg north.
Bitcoin Cash [BCH]
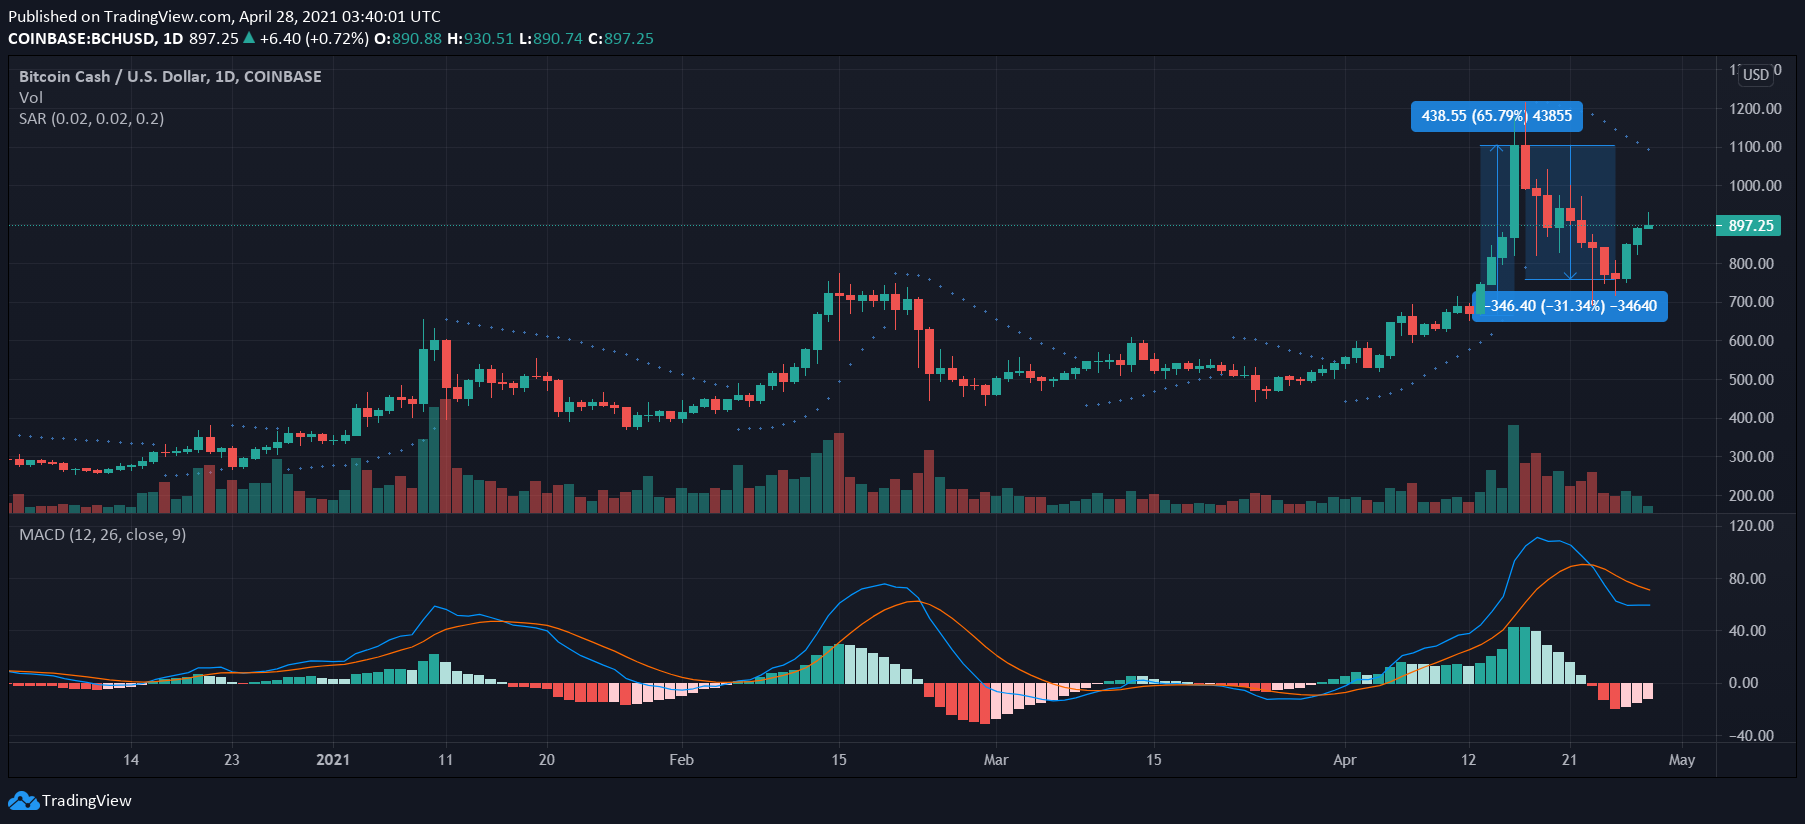
Source: BCH/USD on TradingView
April was turning out to be a good month for Bitcoin Cash, with the fork coin noting a hike of over 65% in less than a week. On the back of Bitcoin’s corrections, however, BCH was quick to follow, with the altcoin falling by over 30% soon after.
BCH’s correlation with BTC was made even more apparent after its recovery efforts followed Bitcoin’s, with BCH’s price charts noting green price candles over the past few days. Curiously, while most altcoins were already on their way up the charts after a trend reversal, the same could not be said about Bitcoin Cash.
The same was evidenced by the altcoin’s technical indicators. While Parabolic SAR’s dotted markers were well over the price candles and pointed to receding bearishness, MACD line was still below the Signal line. If the press time trend continues at pace, a bullish crossover might come by soon.
BCH was in the news a few days ago after community proponents tried to lure Elon Musk and Tesla into accepting the altcoin as payments support.
Bitcoin SV [BSV]

Source: BSV/USD on TradingView
Apart from a set of brief price hikes here and there, Bitcoin SV’s price action for most of the last few months have been strictly rangebound. This behavior was broken in the month of April, however, with the altcoin riding on the coattails of the rest of the market to hike by almost 70% in less than a week.
This wasn’t to last, however, with BSV soon correcting by almost 50% after BTC fell. At the time of writing, while some recovery was afoot, the altcoin was still trading at a level well off its local highs. What’s more, as has been the case for most of the past few months, trade volumes continue to be average.
Awesome Oscillator’s histogram registered a fall in market momentum, with the same falling below the half-line at press time. Relative Strength Index, however, was mediating between the oversold and overbought zones.