
As Bitcoin hits the $58000-mark, several altcoins witnessed a pullback. Altcoins like Bitcoin Cash and Avalanche flashed bearish signs and registered double-digit losses on their daily charts, while Polkadot saw a 4.3% decline over the past 24 hours.
Polkadot (DOT)
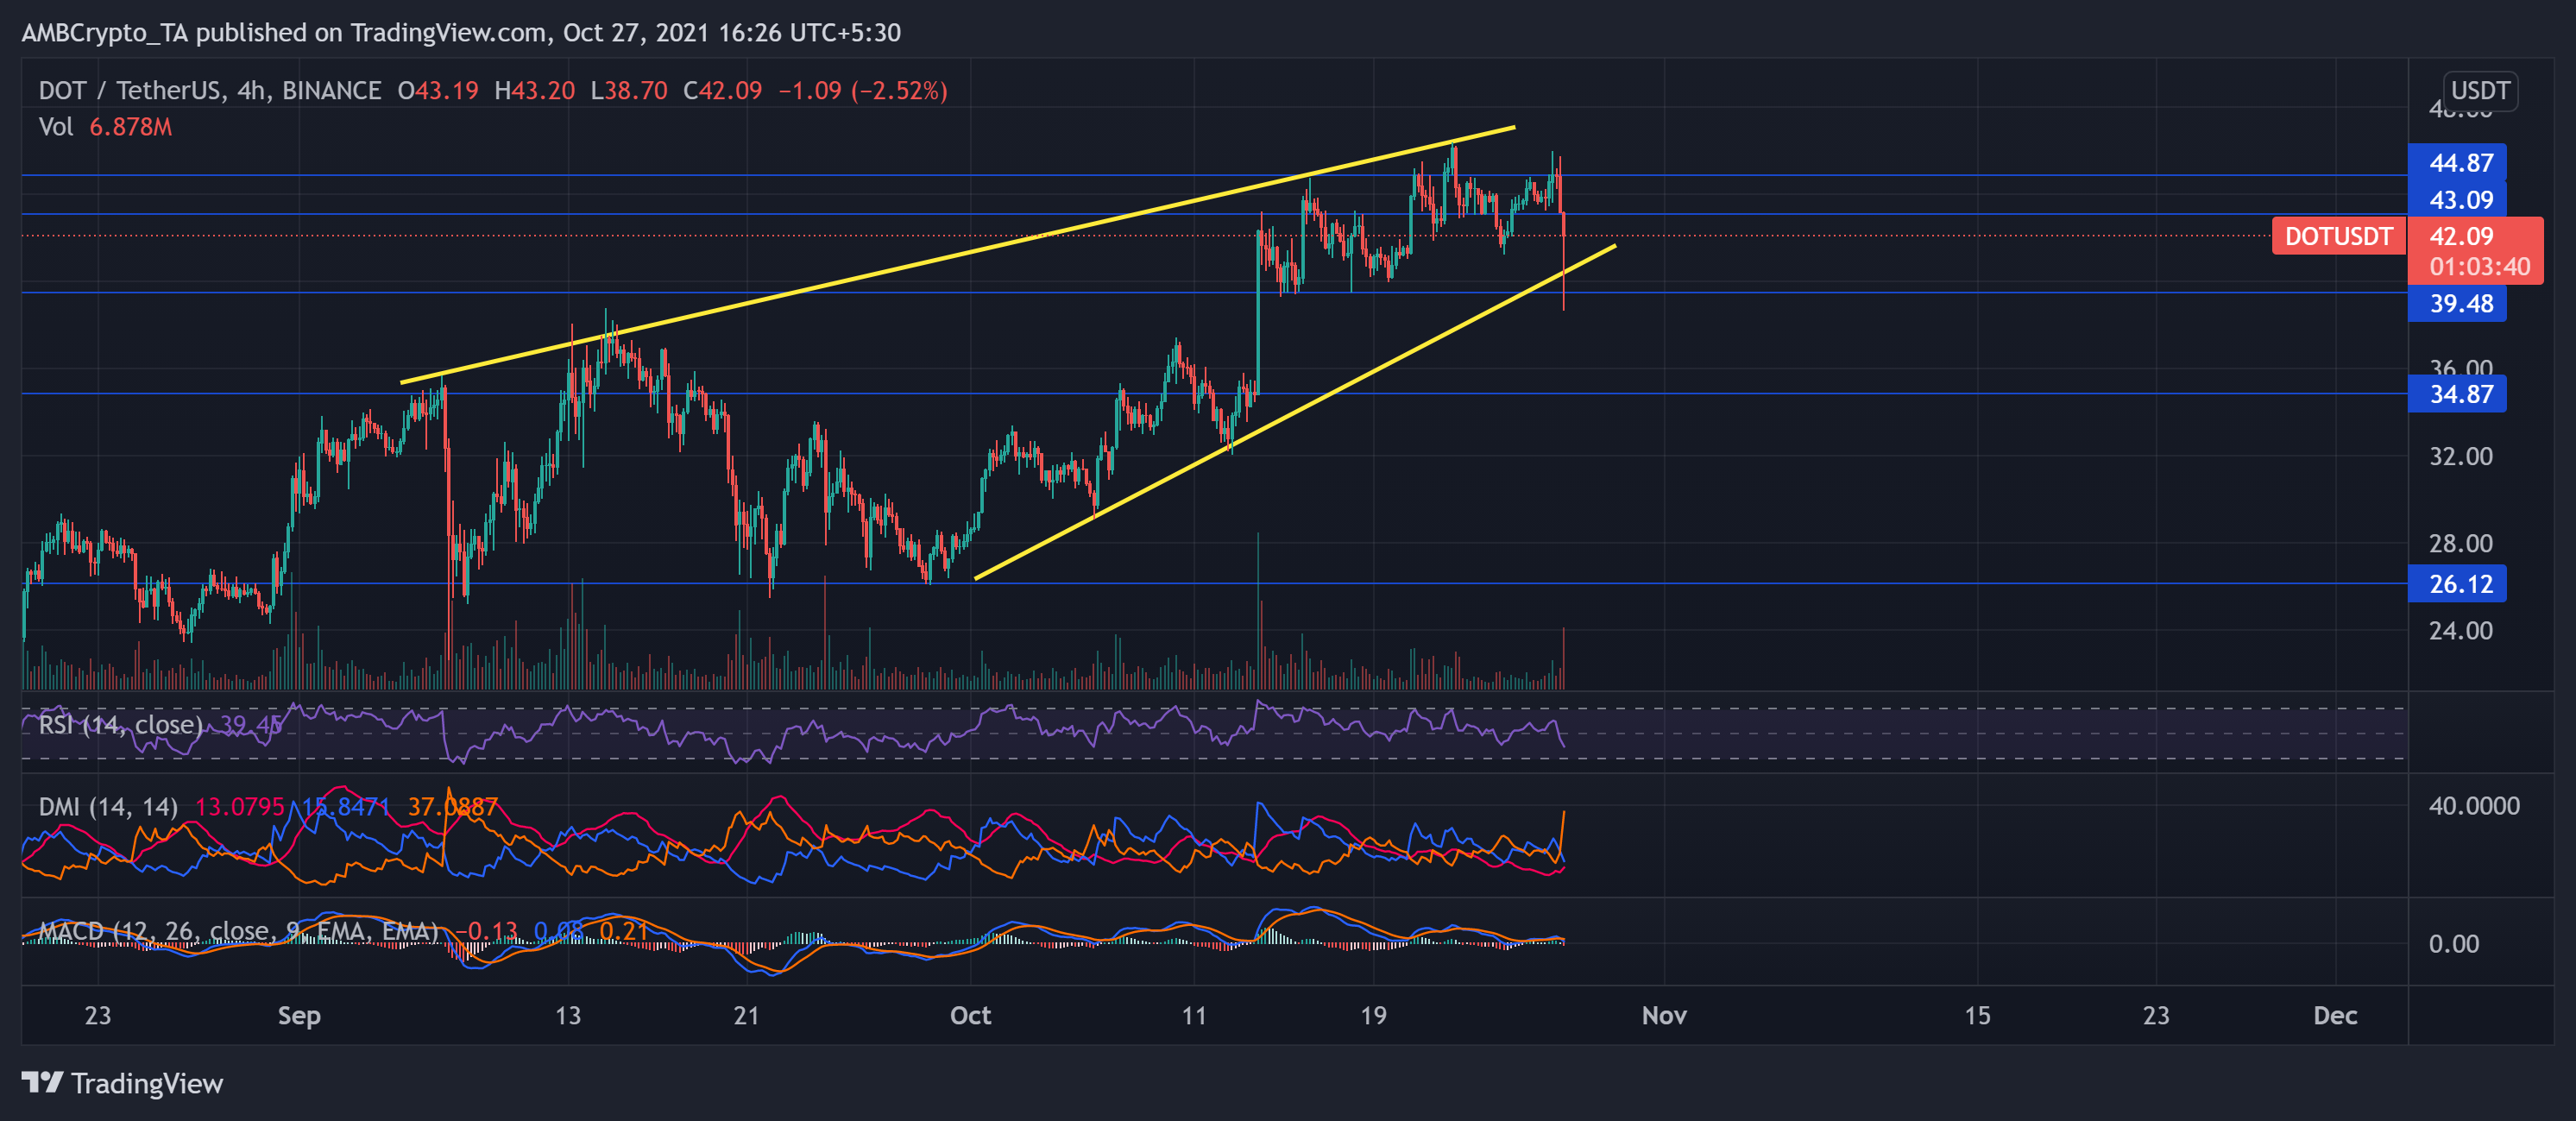
TradingView, DOT/ USDT
The altcoin traded at $42.09 after noting a nearly 50.53% gain over the last month. Since the inception of the month, DOT price action has displayed a bullish trajectory by oscillating in an ascending wedge pattern. This rally, coupled with the anticipation of the Parachain launch in November, has somewhat caused disappointment for the DOT bears. However, key technical indicators pointed towards a preference for the sellers in the near term.
The Relative Strength Index (RSI) stood at 38.18, indicating a one-sided preference for the sellers. Furthermore, the Signal Line (orange) rapidly headed north and favored the sellers, while the MACD histogram also agreed with the previous readings.
Now, if the bulls take over, DOT would bounce back from the lower trendline and maintain its overall uptrend. But, if the price falls below the lower trendline, investors can anticipate more losses and find new support at the $34-mark.
Bitcoin Cash (BCH)
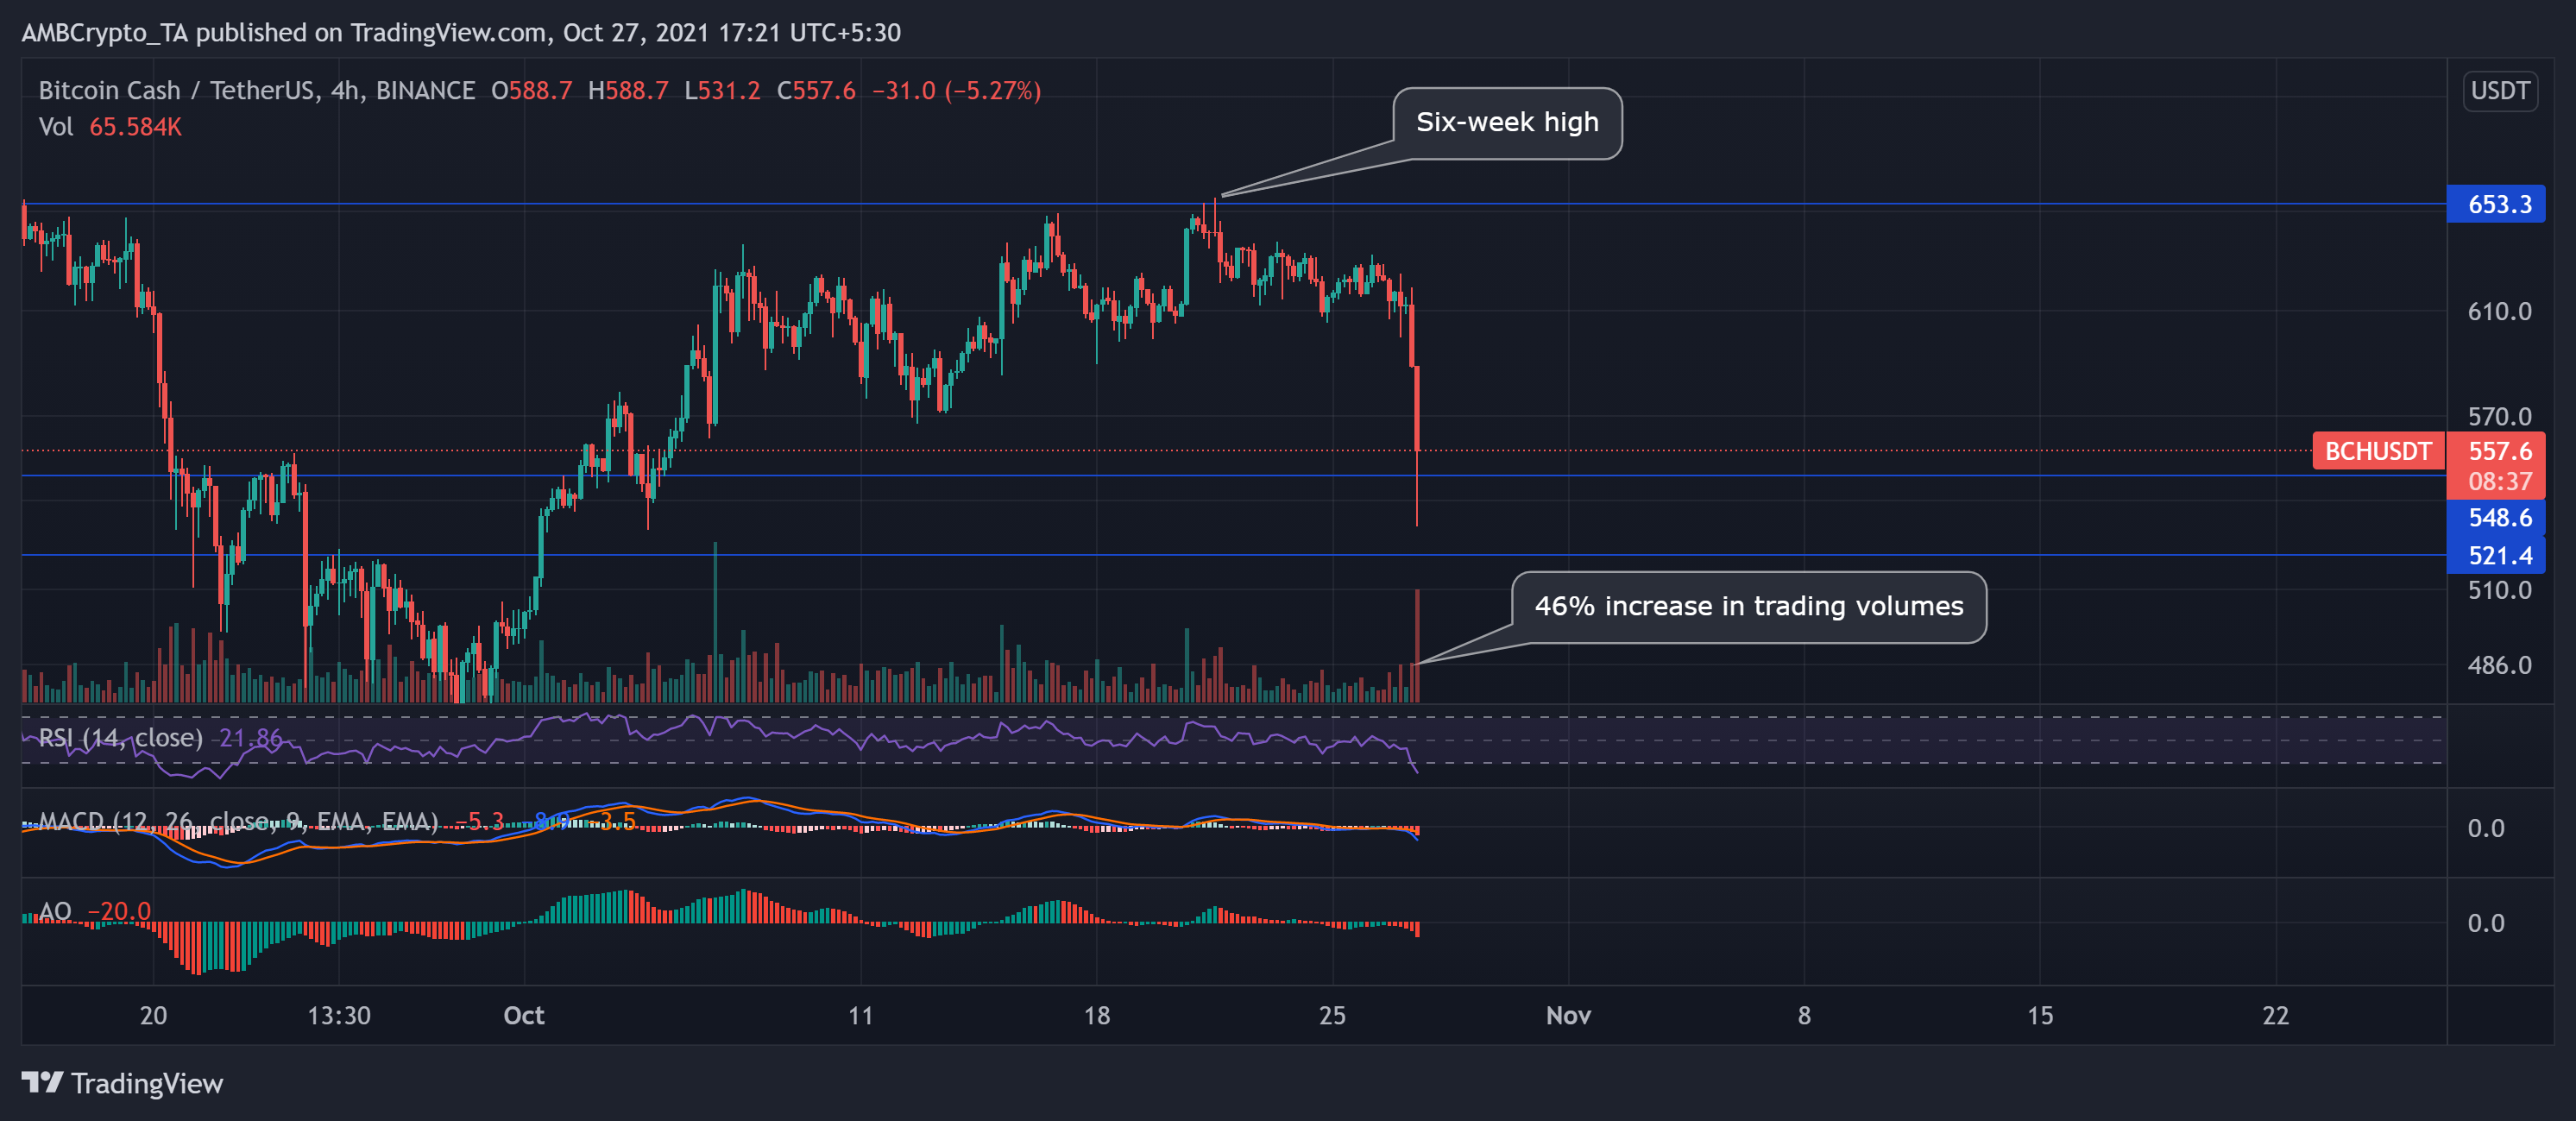
TradingView, BCH/USDT
Since the beginning of October, BCH bulls showed their vigor as the price action rallied towards a six-week high on 21 October. Since then, bears exerted pressure and ensured resistance at the $653-mark. The altcoin traded at $557.6 and saw a 10.44% decline on its chart over the last day.
The RSI was deep into the oversold territory. Also, the trading volumes rose by 45% over the last day, indicating a fierce directional strength in favor of sellers. Further, the MACD histogram and the Awesome Oscillator flashed red signals and resonated with the previous readings. Nevertheless, since the RSI stood at the 21-mark, so the chances of reversal does exist in the near term.
Avalanche (AVAX)
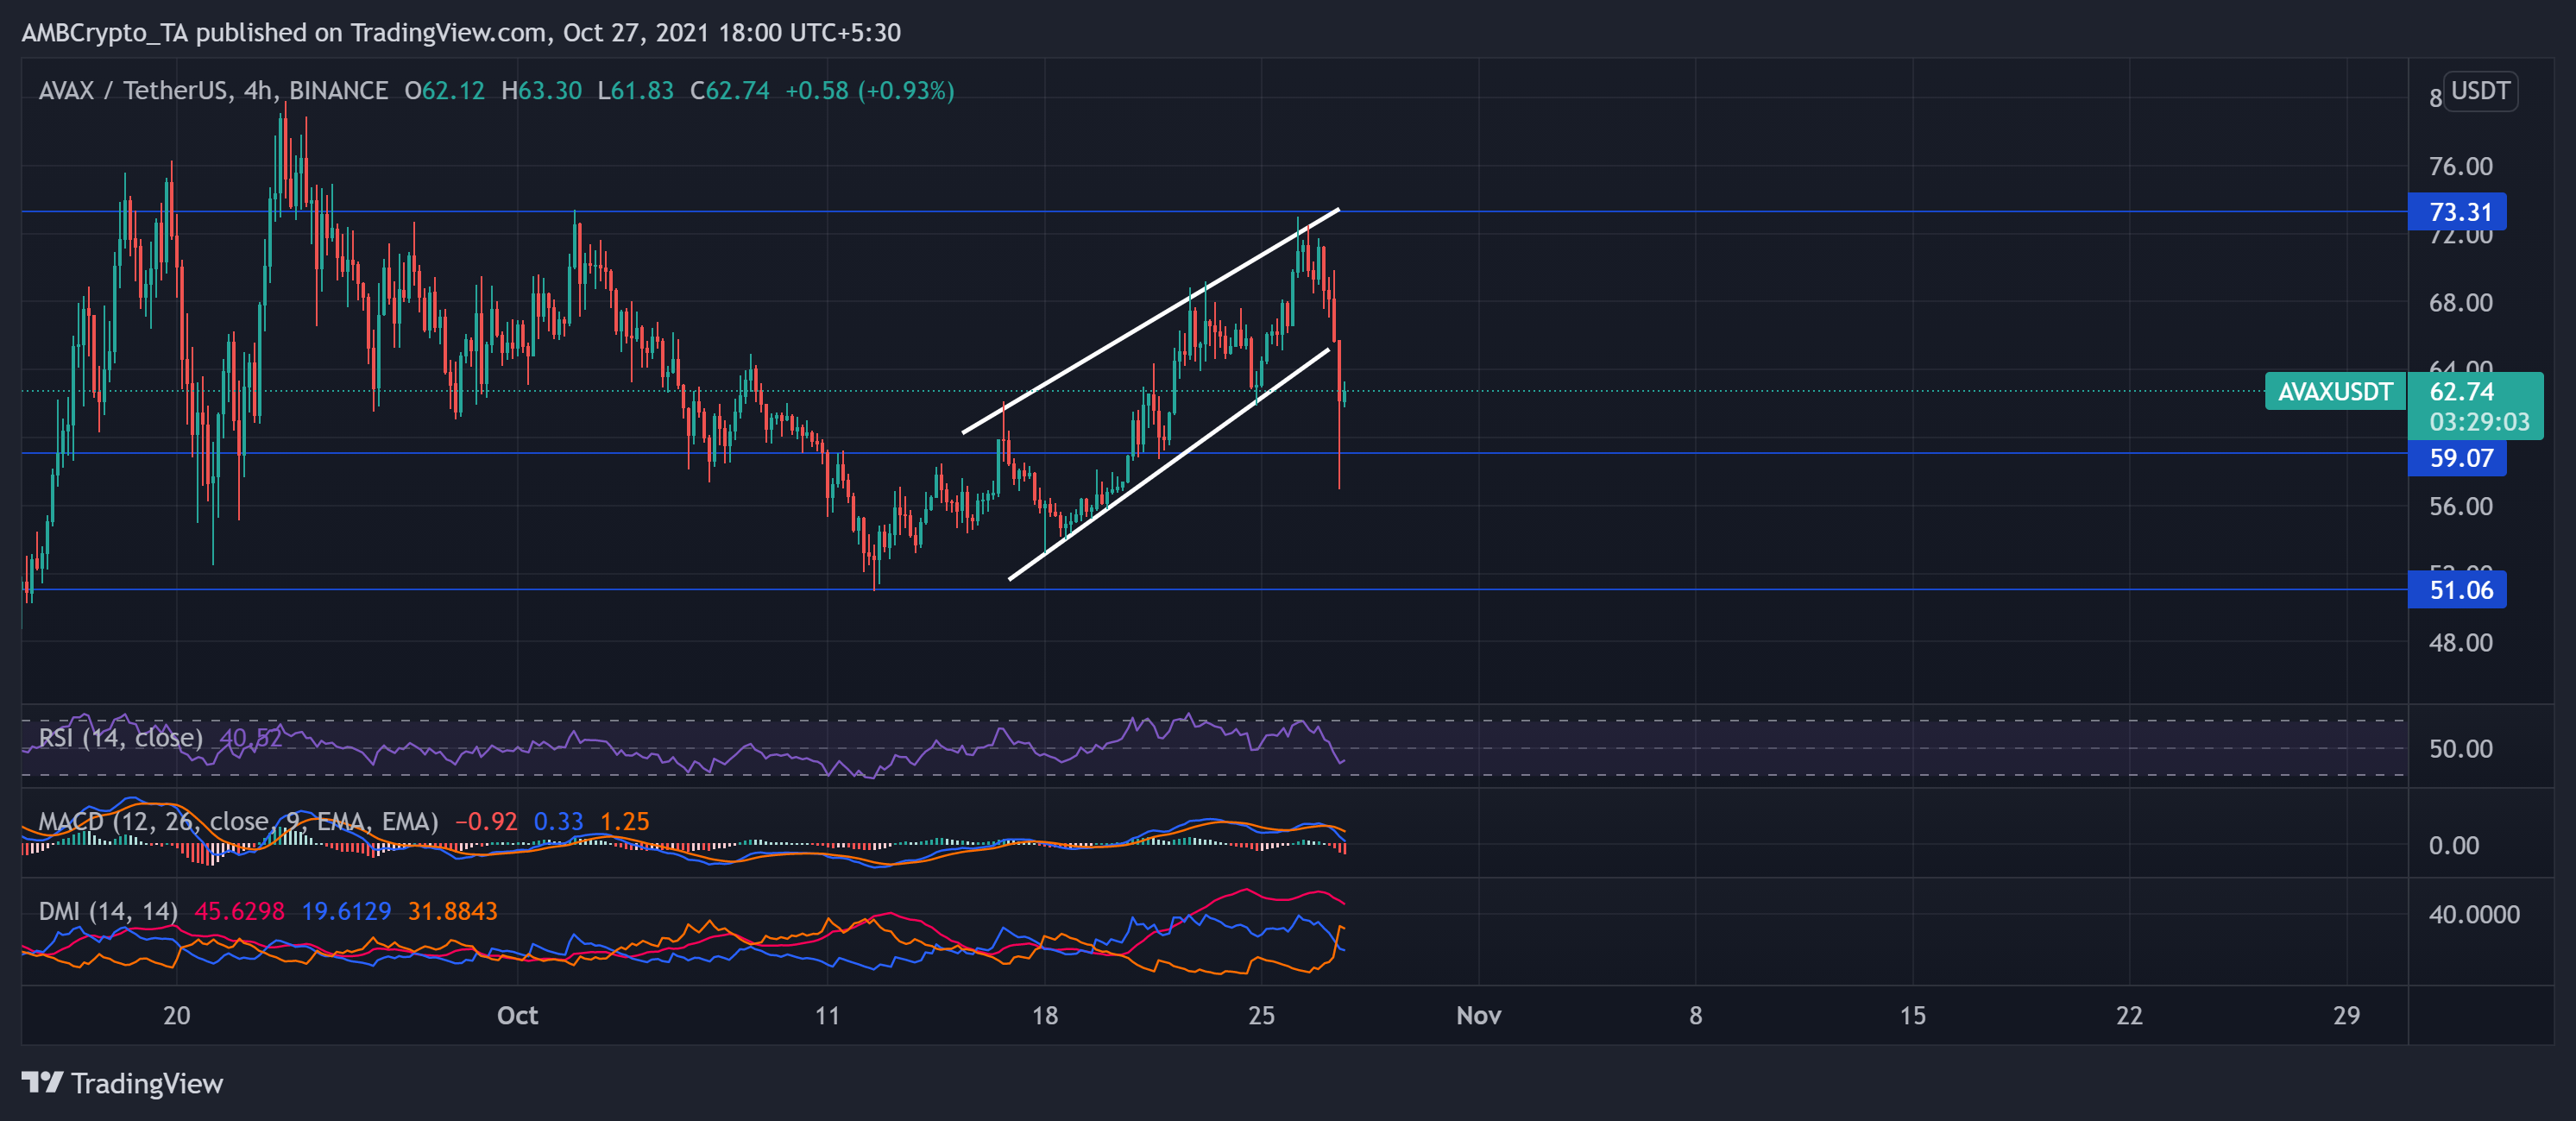
TradingView, AVAX/USDT
AVAX couldn’t follow the ascending pattern formed since 15 October as it couldn’t breach the immediate resistance that stood at the $73-mark. After reaching its 25-day high on 26 October, AVAX witnessed a pullback as bears exerted pressure on increasing trading volumes. The digital currency noted an 11.49% decrease over the past 24 hours and traded at $62.74 at press time.
The RSI stood at the 41-mark, indicating a preference for the seller’s momentum. Also, the MACD rapidly plunged, looking to head south. Besides, the DMI affirmed the rapid decrease in buying power while the ADX line displayed a powerful directional trend in the near term.