Polkadot bulls fail to hold on to $6.92 as support, what can come next?

Disclaimer: The information presented does not constitute financial, investment, trading, or other types of advice and is solely the writer’s opinion.
- The daily structure was bullish but lower timeframes asserted bearishness.
- This meant a deeper retracement beneath $6.5 was likely.
Since early January, Polkadot has performed bullishly on the price charts. This was a trend seen across the altcoin market, so DOT was no exception. Like the rest of the market, Polkadot has also run into strong bearish pressure over the past few days.
Is your portfolio green? Check the Polkadot Profit Calculator
The strong rally from $6 earlier this month saw most of the gains retraced over the past week. The psychological round number at $6 coincided with a bullish order block on the daily timeframe, highlighted in cyan.
It was likely that Polkadot would drop beneath $6.5 in the coming days and possibly as low as $6.
The H4 FVG failed to initiate a rally and the bears were dominant
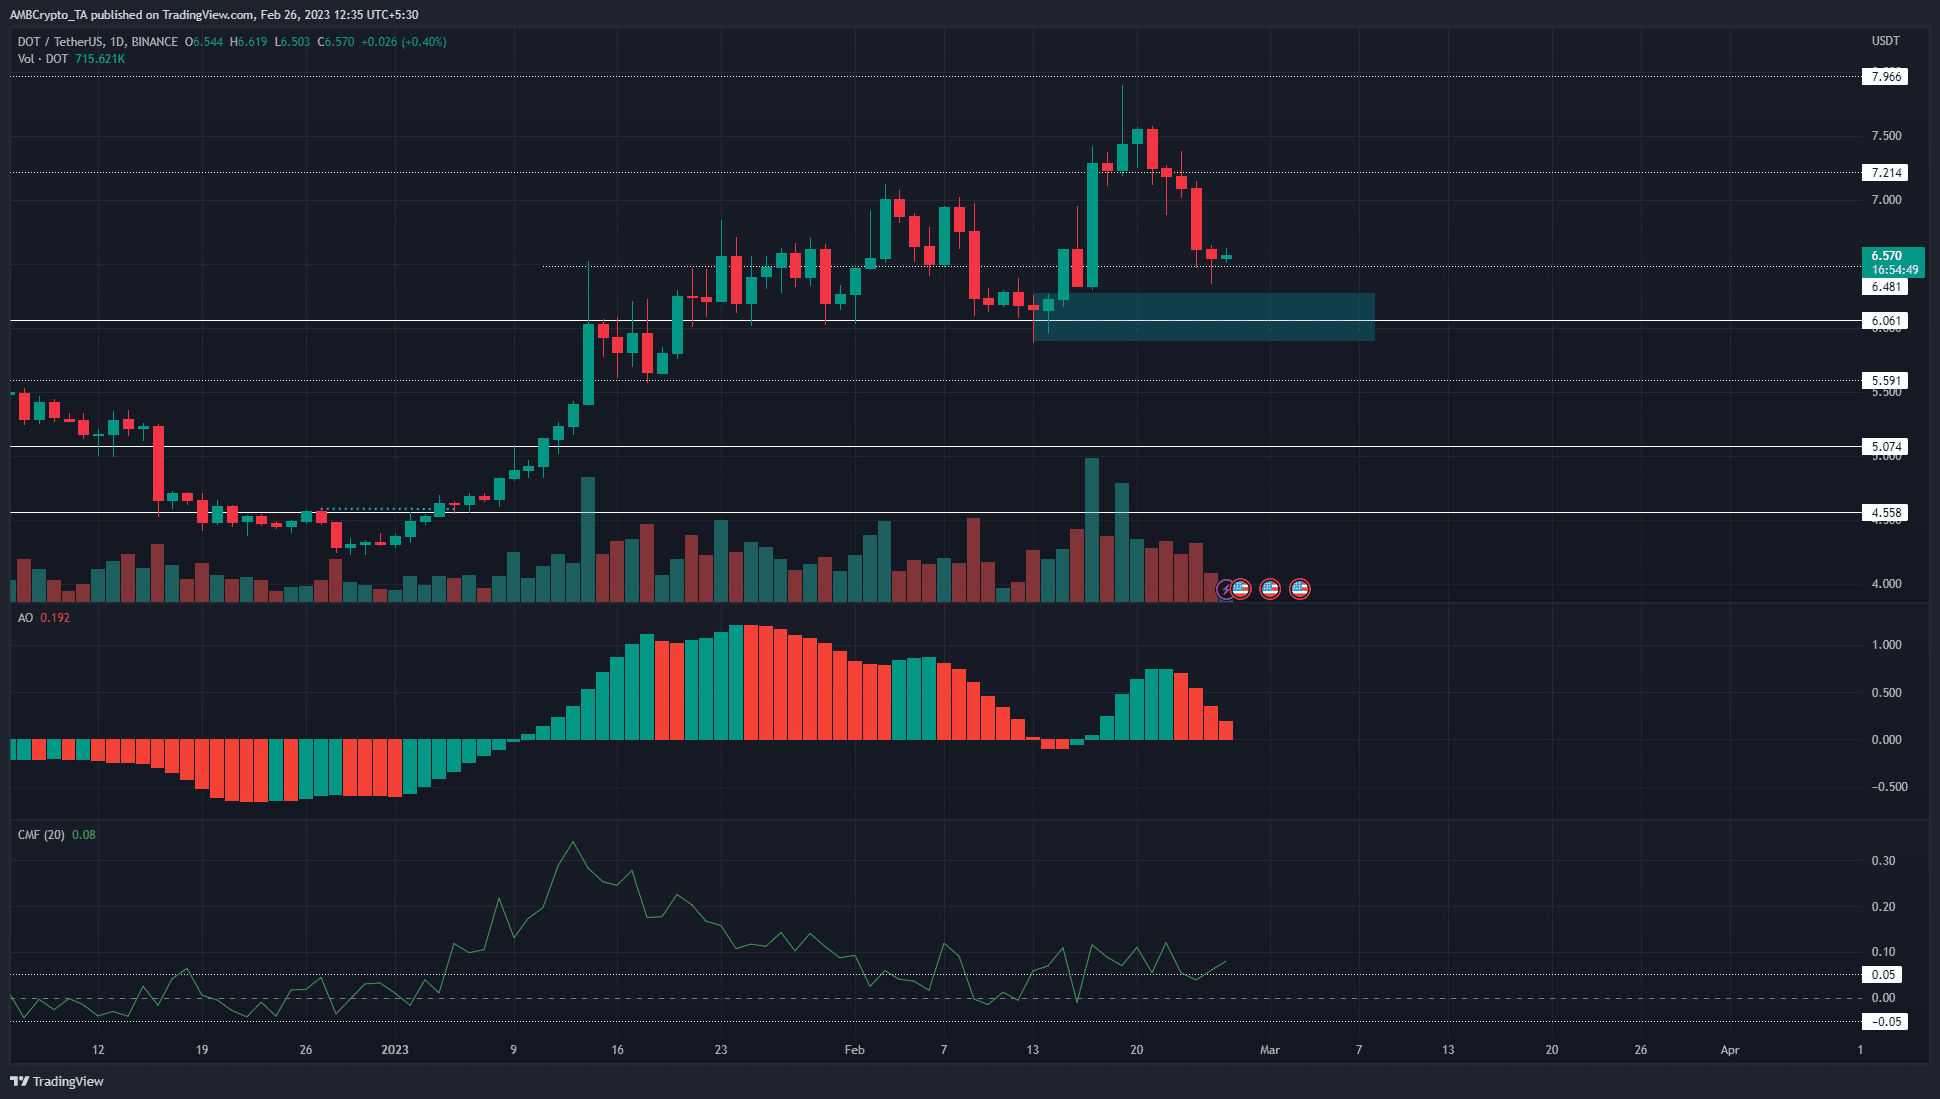
The daily chart showed that although bearish pressure has been significant in the past week, bulls can look to bid at the $6 area. The mid-February rally from $6 had been strong and breached $7 with ease, and reached $7.9 on 19 February.
Since then, the prices have slumped to trade at $6.57 at press time. This amounted to losses of 16.6% within the space of a week. Analysis of lower timeframe charts such as the 4-hour showed the bears were firmly in the driving seat.
The price had left an H4 imbalance in the $6.9-7.15 zone. Although there was a bounce from $6.9 on 22 February, it was not enough to break past $7.36. Now, DOT sat atop another support at $6.48, with $6.3 and $6 as further support levels to the south.
How much are 1, 10, and 100 DOT worth today?
The Awesome Oscillator was above the zero line but made red bars on the histogram to show the bulls were weakening in the past week. The CMF was at +0.08, which showed significant capital flow into the market.
The bias on the daily timeframe was weak bullish, and a retracement into the $6 area could offer a buying opportunity. Till then, lower timeframe traders can look to short the asset.
The sentiment was bearish behind Polkadot
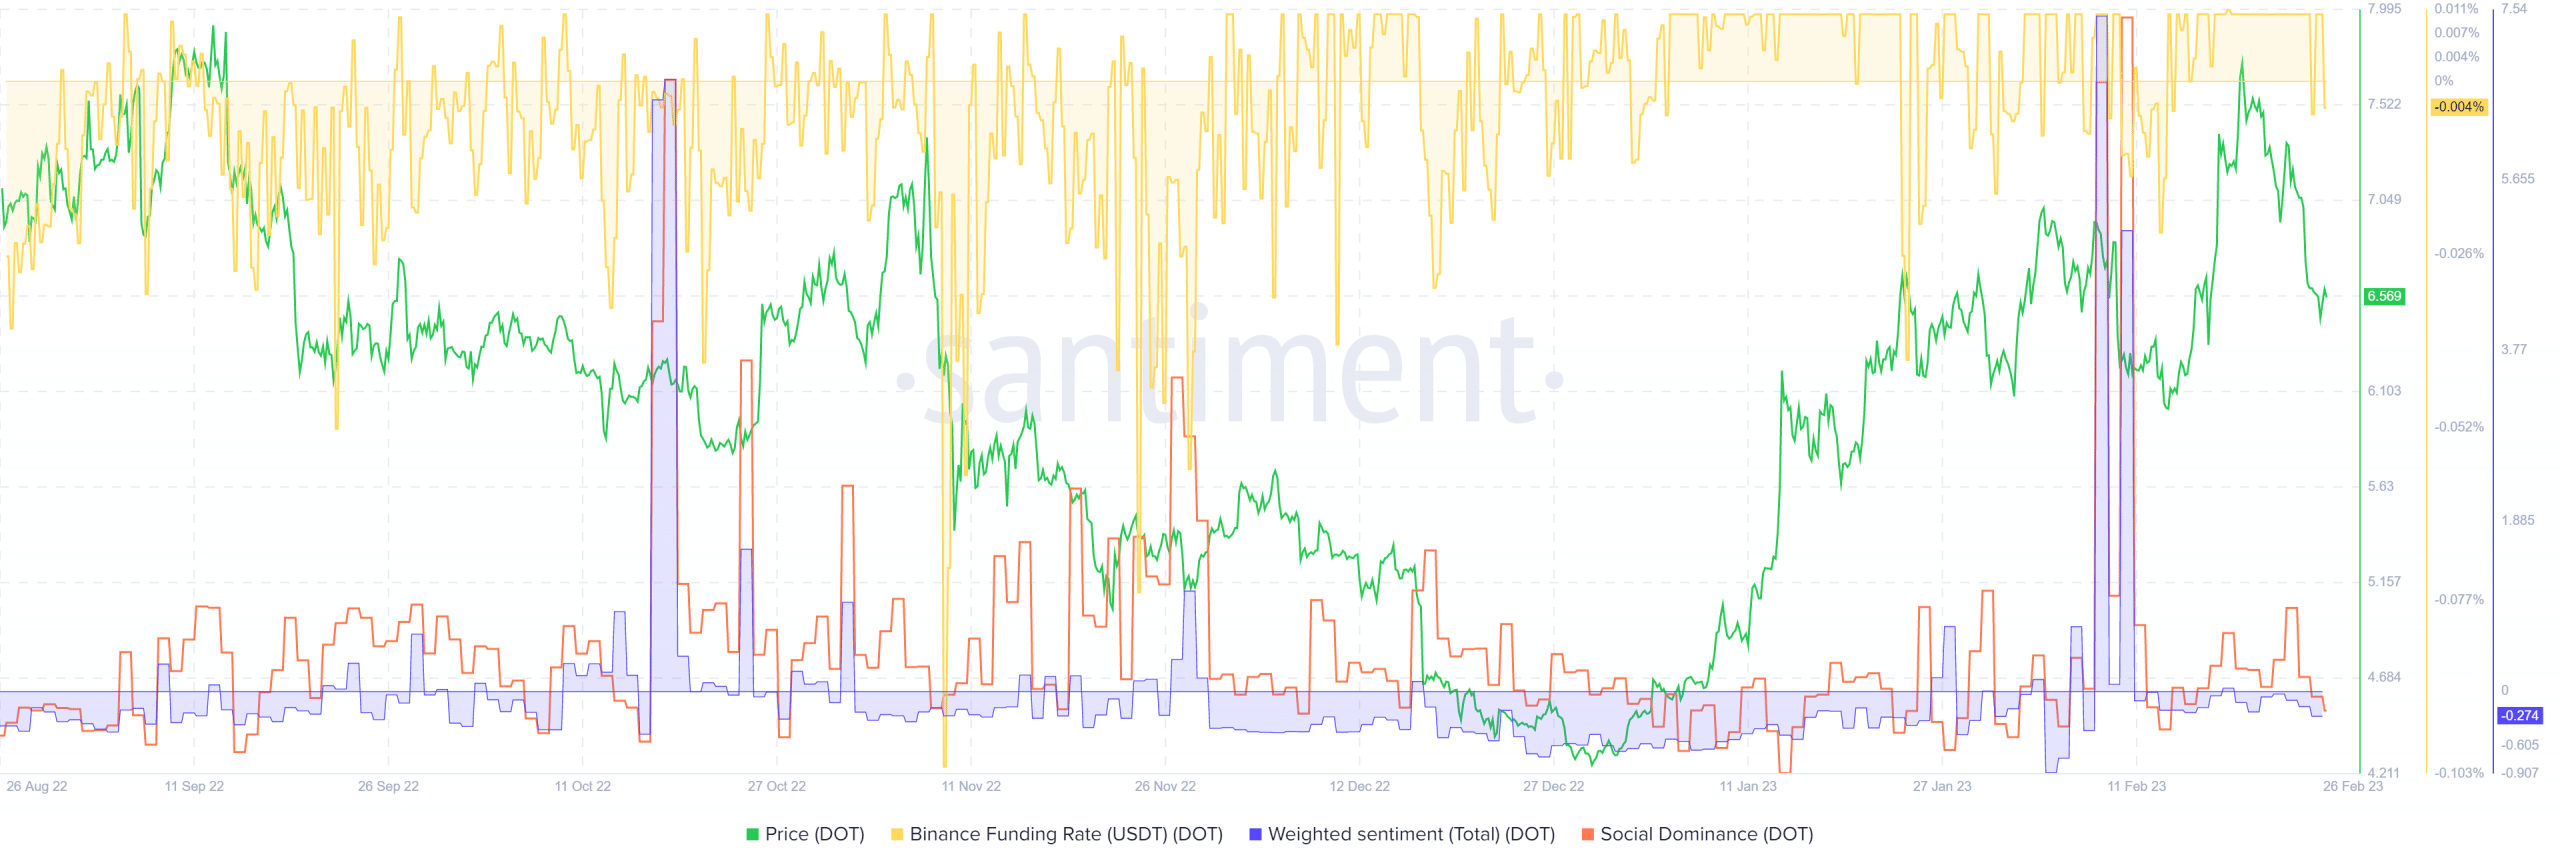
The funding rate on Binance slipped into negative territory in recent hours to show short sellers had an upper hand. The weighted sentiment was also negative, according to Santiment data. Social dominance was 0.6% at best in February and stood at 0.32% at press time.
Taken together the indication was that the market participants leaned bearish toward the asset.