Polkadot, Crypto.com Coin, Dogecoin Price Analysis: 12 March

Polkadot approached a region of demand that bulls would need to defend in order to push the prices back toward $40. Crypto.com Coin could see a minor dip on its uptrend, while Dogecoin was trading above the $0.054 level of support.
Polkadot [DOT]
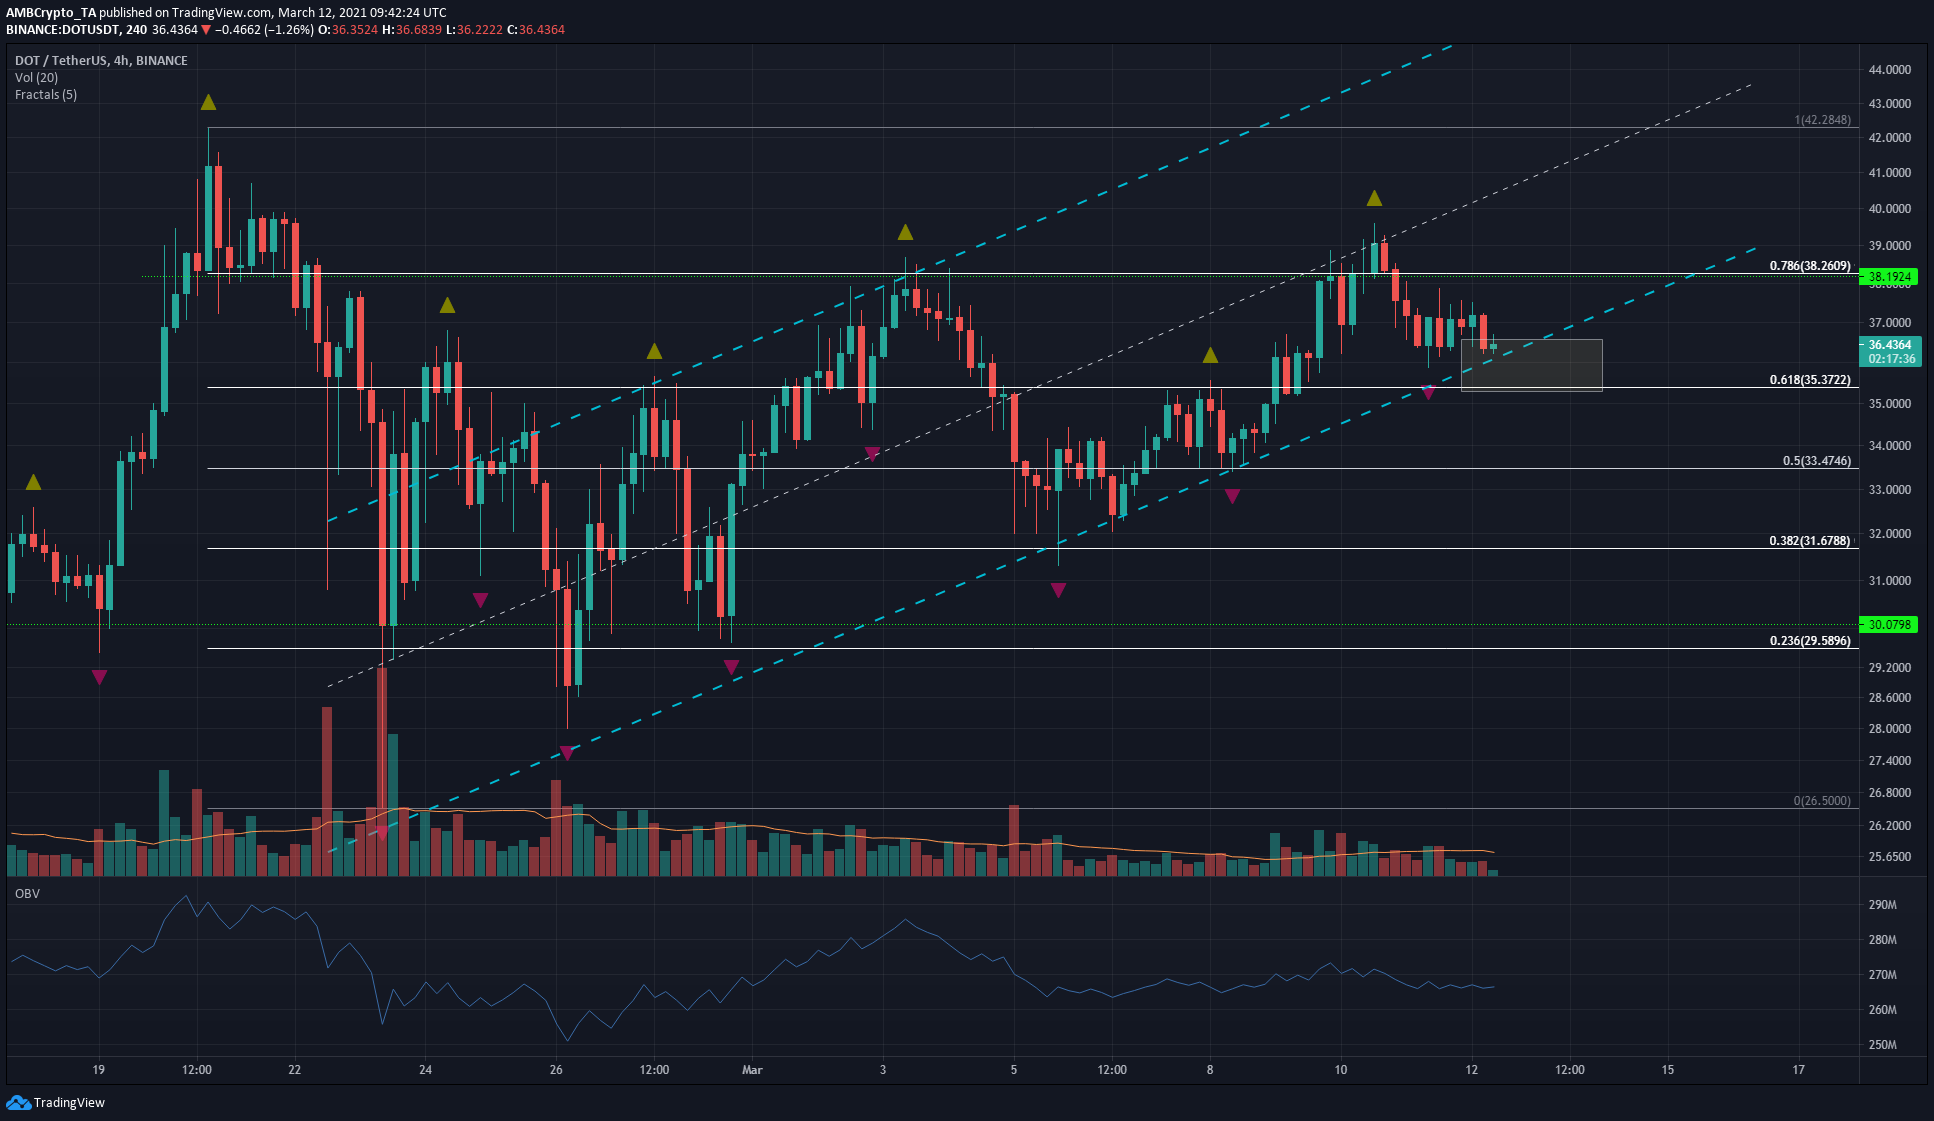
Polkadot was trading within an ascending channel (cyan) but at the time of writing, the price was right at the lower boundary of the channel. The highlighted region at $35.3-$36.5 is a possible region of demand.
Both the lower boundary of the channel as well as the retracement level at $35.37 can be expected to serve as support. Losing this region to bearish pressure will likely see DOT move toward the $30 mark.
The OBV showed that buyers have not been in a strong position since DOT fell from $42, as the OBV formed lower highs since then, and closing beneath the channel could force more selling.
Crypto.com Coin [CRO]
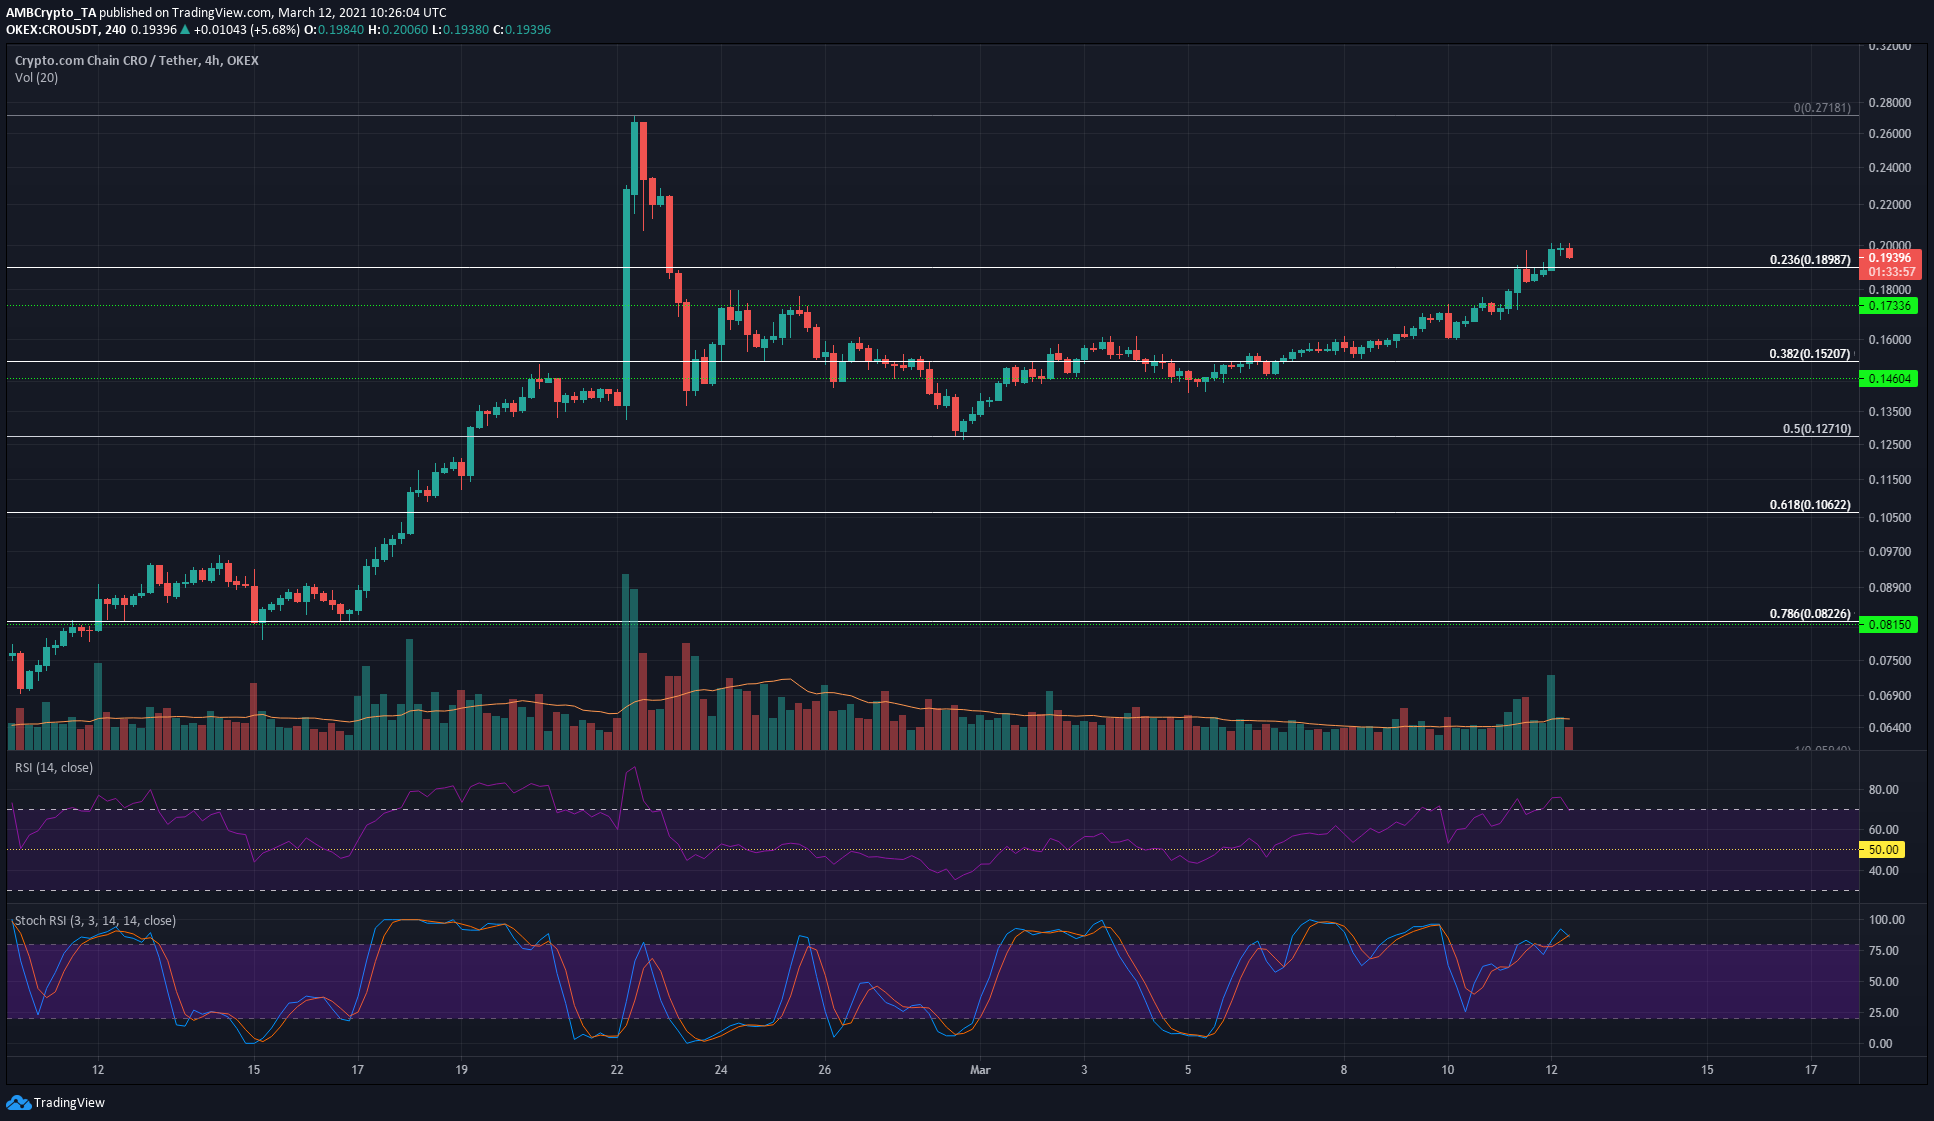
The RSI and Stochastic RSI were in overbought territory on the 4-hour charts as CRO rose past the $0.189 level. This represents a 23.6% retracement of its move from $0.059 to highs of $0.271.
Its correction from the local highs at $0.271 saw the price test the 50% retracement level, and since then CRO has steadily climbed upward. Hence, in the long-term, the $0.195 mark is a good area to buy CRO.
However, over the next few hours, some consolidation in this region can be seen. Beneath $0.195, the $0.183 mark can also serve as support.
Dogecoin [DOGE]
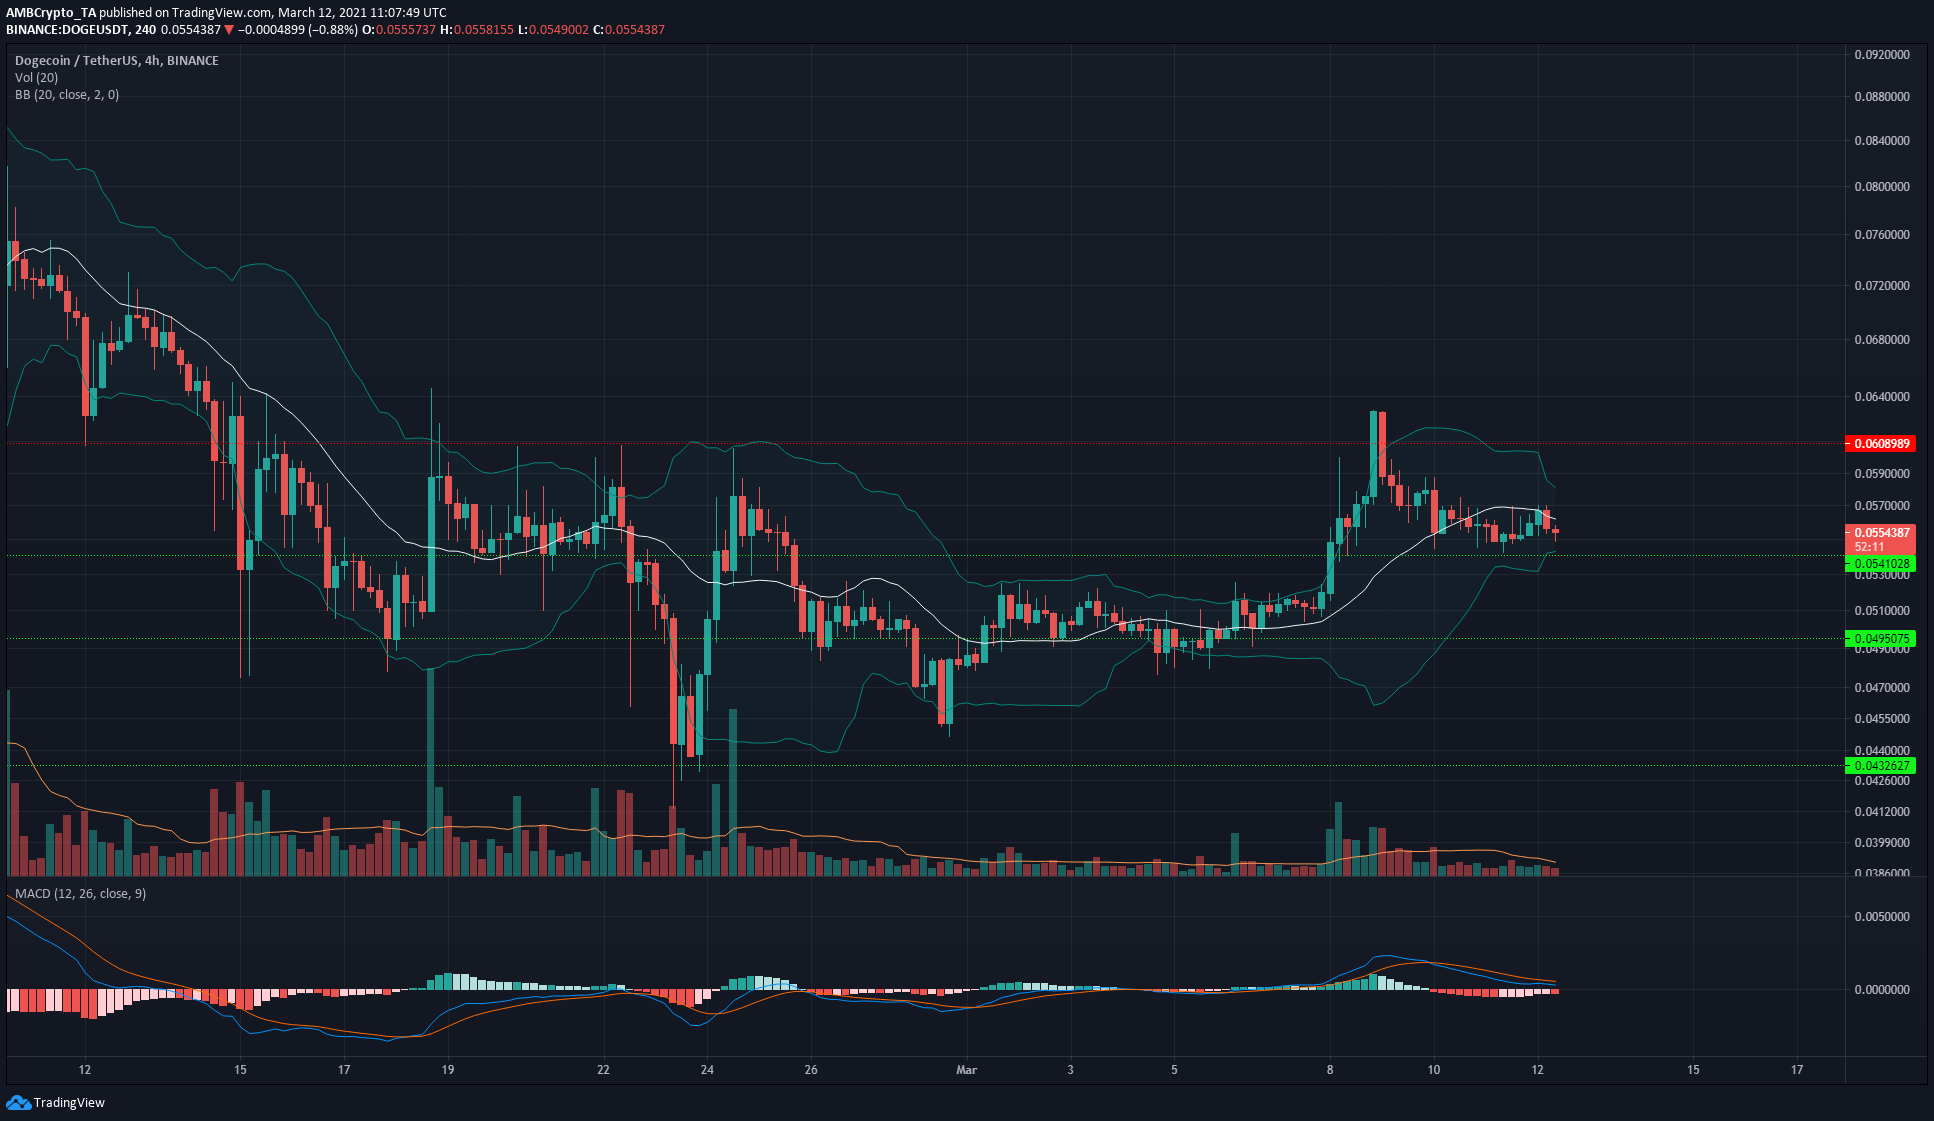
Dogecoin continued to trade beneath the $0.06 mark. The MACD showed bearish momentum was on the rise for DOGE, as the MACD line dived toward the zero line and could see a bearish crossover if DOGE loses the $0.054 level to bears.
The Bollinger bands were relatively wide around DOGE, after its attempt to breach the $0.06 mark over the past few days and subsequent rejection.
At the time of writing, the price was beneath the 20 SMA (white) and headed toward the lower band.


