Polkadot [DOT]: Pall of uncertainty over price despite surging metrics
![Polkadot [DOT]: Pall of uncertainty over price despite surging metrics](https://ambcrypto.com/wp-content/uploads/2023/03/AMBCrypto_A_construction_site_with_cranes_and_heavy_machinery_i_aa068703-4e73-4705-b56b-d4fed46c68e4.jpg)
- Polkadot was the blockchain network with the highest development activity in the last 30 days.
- DOT traded within a narrow range in the last week as investors remain unsure of the coin’s next direction.
Layer 0 blockchain Polkadot [DOT] has emerged as the leading blockchain network in terms of development activity in the last 30 days, new data from Santiment revealed.
?? Top 10 #crypto assets by development activity: notable #github commits, past 30 days:
1) #Polkadot $DOT
2) #Kusama $KSM
3) #Cardano $ADA
4) #InternetComputer $ICP
5) #Ethereum $ETH
6) #Status $SNT
7) #Hedera $HBAR
8) #Cosmos $ATOM
9) #Chainlink $LINK
10) #Decentraland $MANA pic.twitter.com/4vOnIuUR7a— Santiment (@santimentfeed) March 24, 2023
Read Polkadot’s [DOT] Price Prediction 2023-24
According to the on-chain data provider, Polkadot GitHub commits during the period under review totaled 591.47, tying with Kusama. The Ethereum [ETH] network, on the other hand, logged a development activity count of 387.67, putting it four places behind Polkadot.
Development activity is an important metric as it offers insights into a crypto project’s commitment to creating a working product and the likelihood of shipping new features. In addition, a high development activity often reduces the possibility of the project being an exit scam.
DOT wading through troubled waters
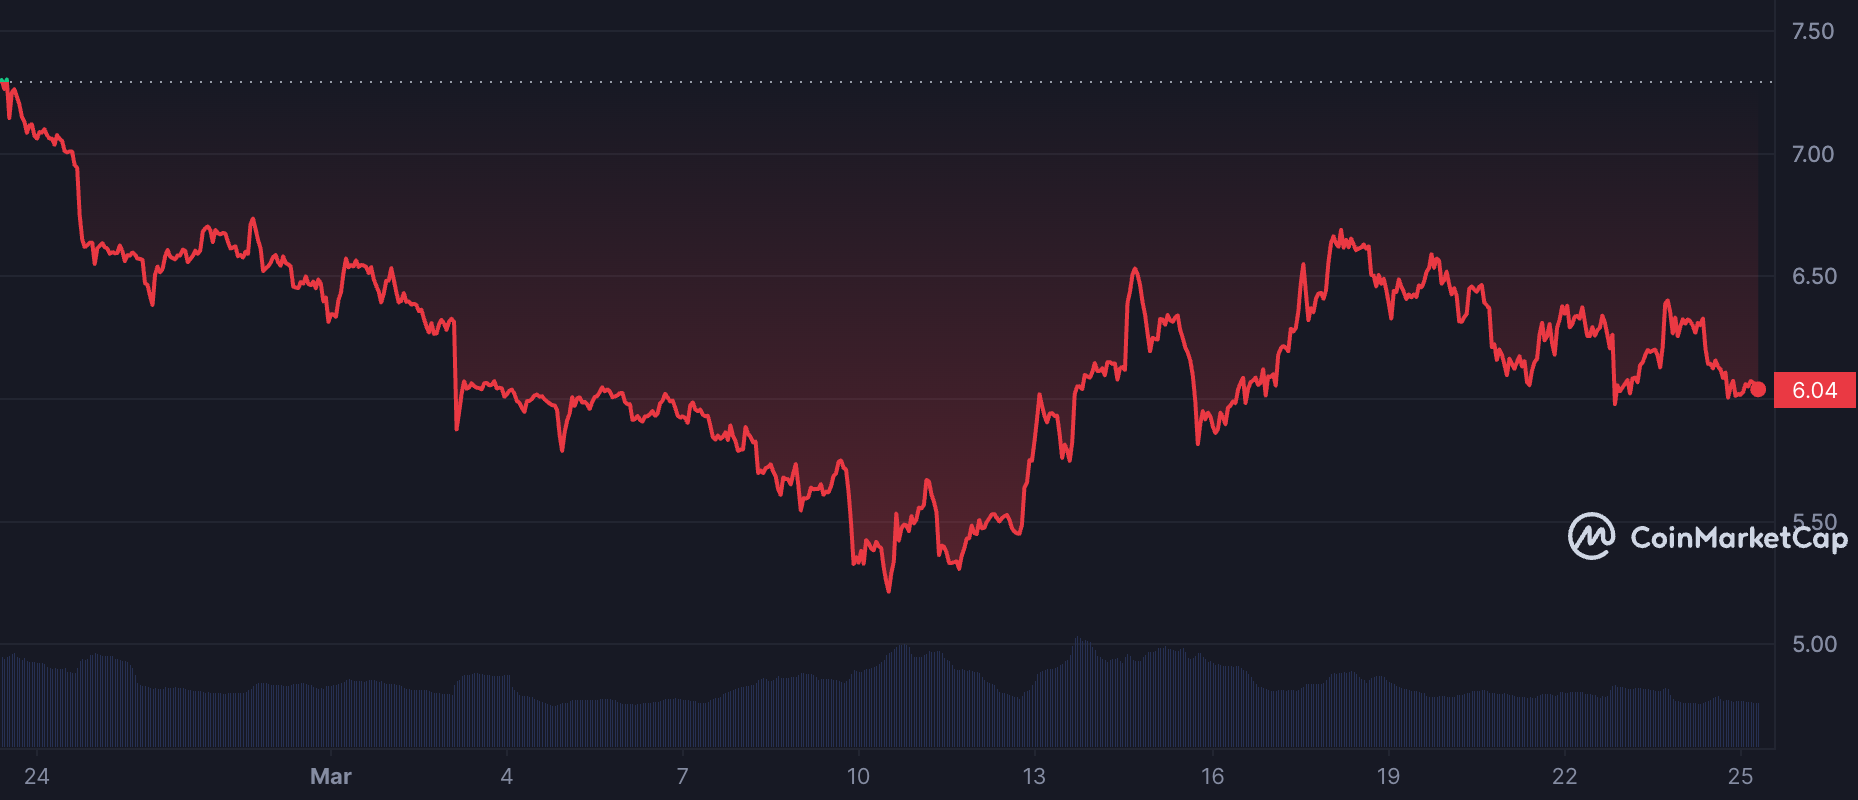
Despite sharing a statistically significant positive correlation with Bitcoin [BTC], whose value jumped by 13% in the last 30 days, DOT’s value decreased by 17% during the same period.
The drop in DOT’s value occurred despite the optimistic sentiment that lingered in the cryptocurrency market and investors’ increased accumulation in the face of uncertain macro factors.
According to data from CoinMarketCap, the altcoin exchanged hands at $6.04 at press time.
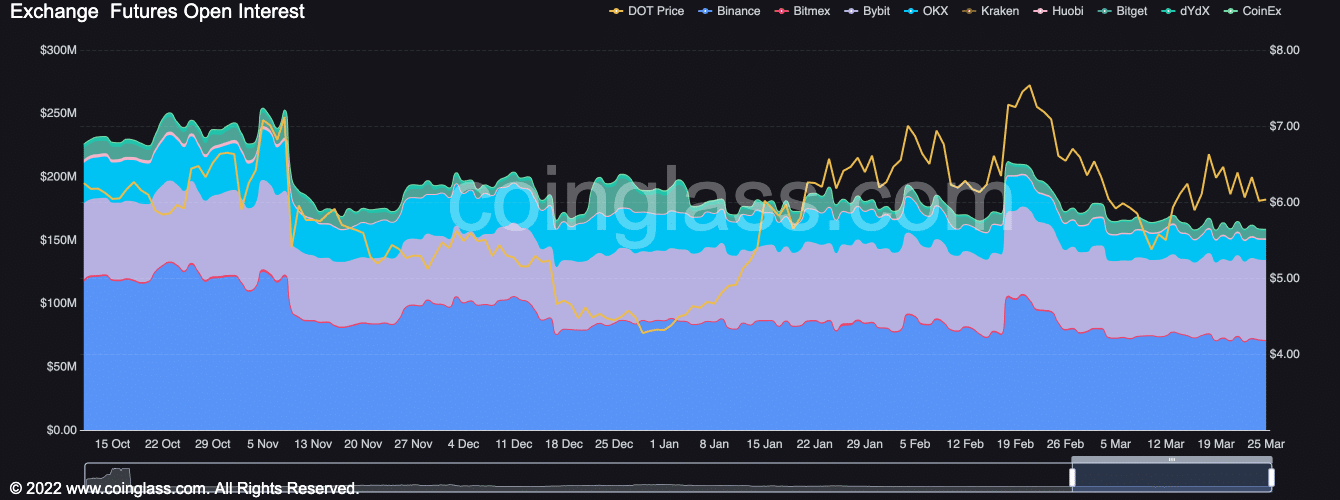
The decline in value is partly attributable to the fall in the token’s Open Interests since 17 February. According to Coinglass, DOT’s Open Interest has since fallen by 25%.
When a crypto asset’s Open Interest falls, it indicates reduced trading activity, as investors may be closing their positions or taking profits.
Up or down, who knows?
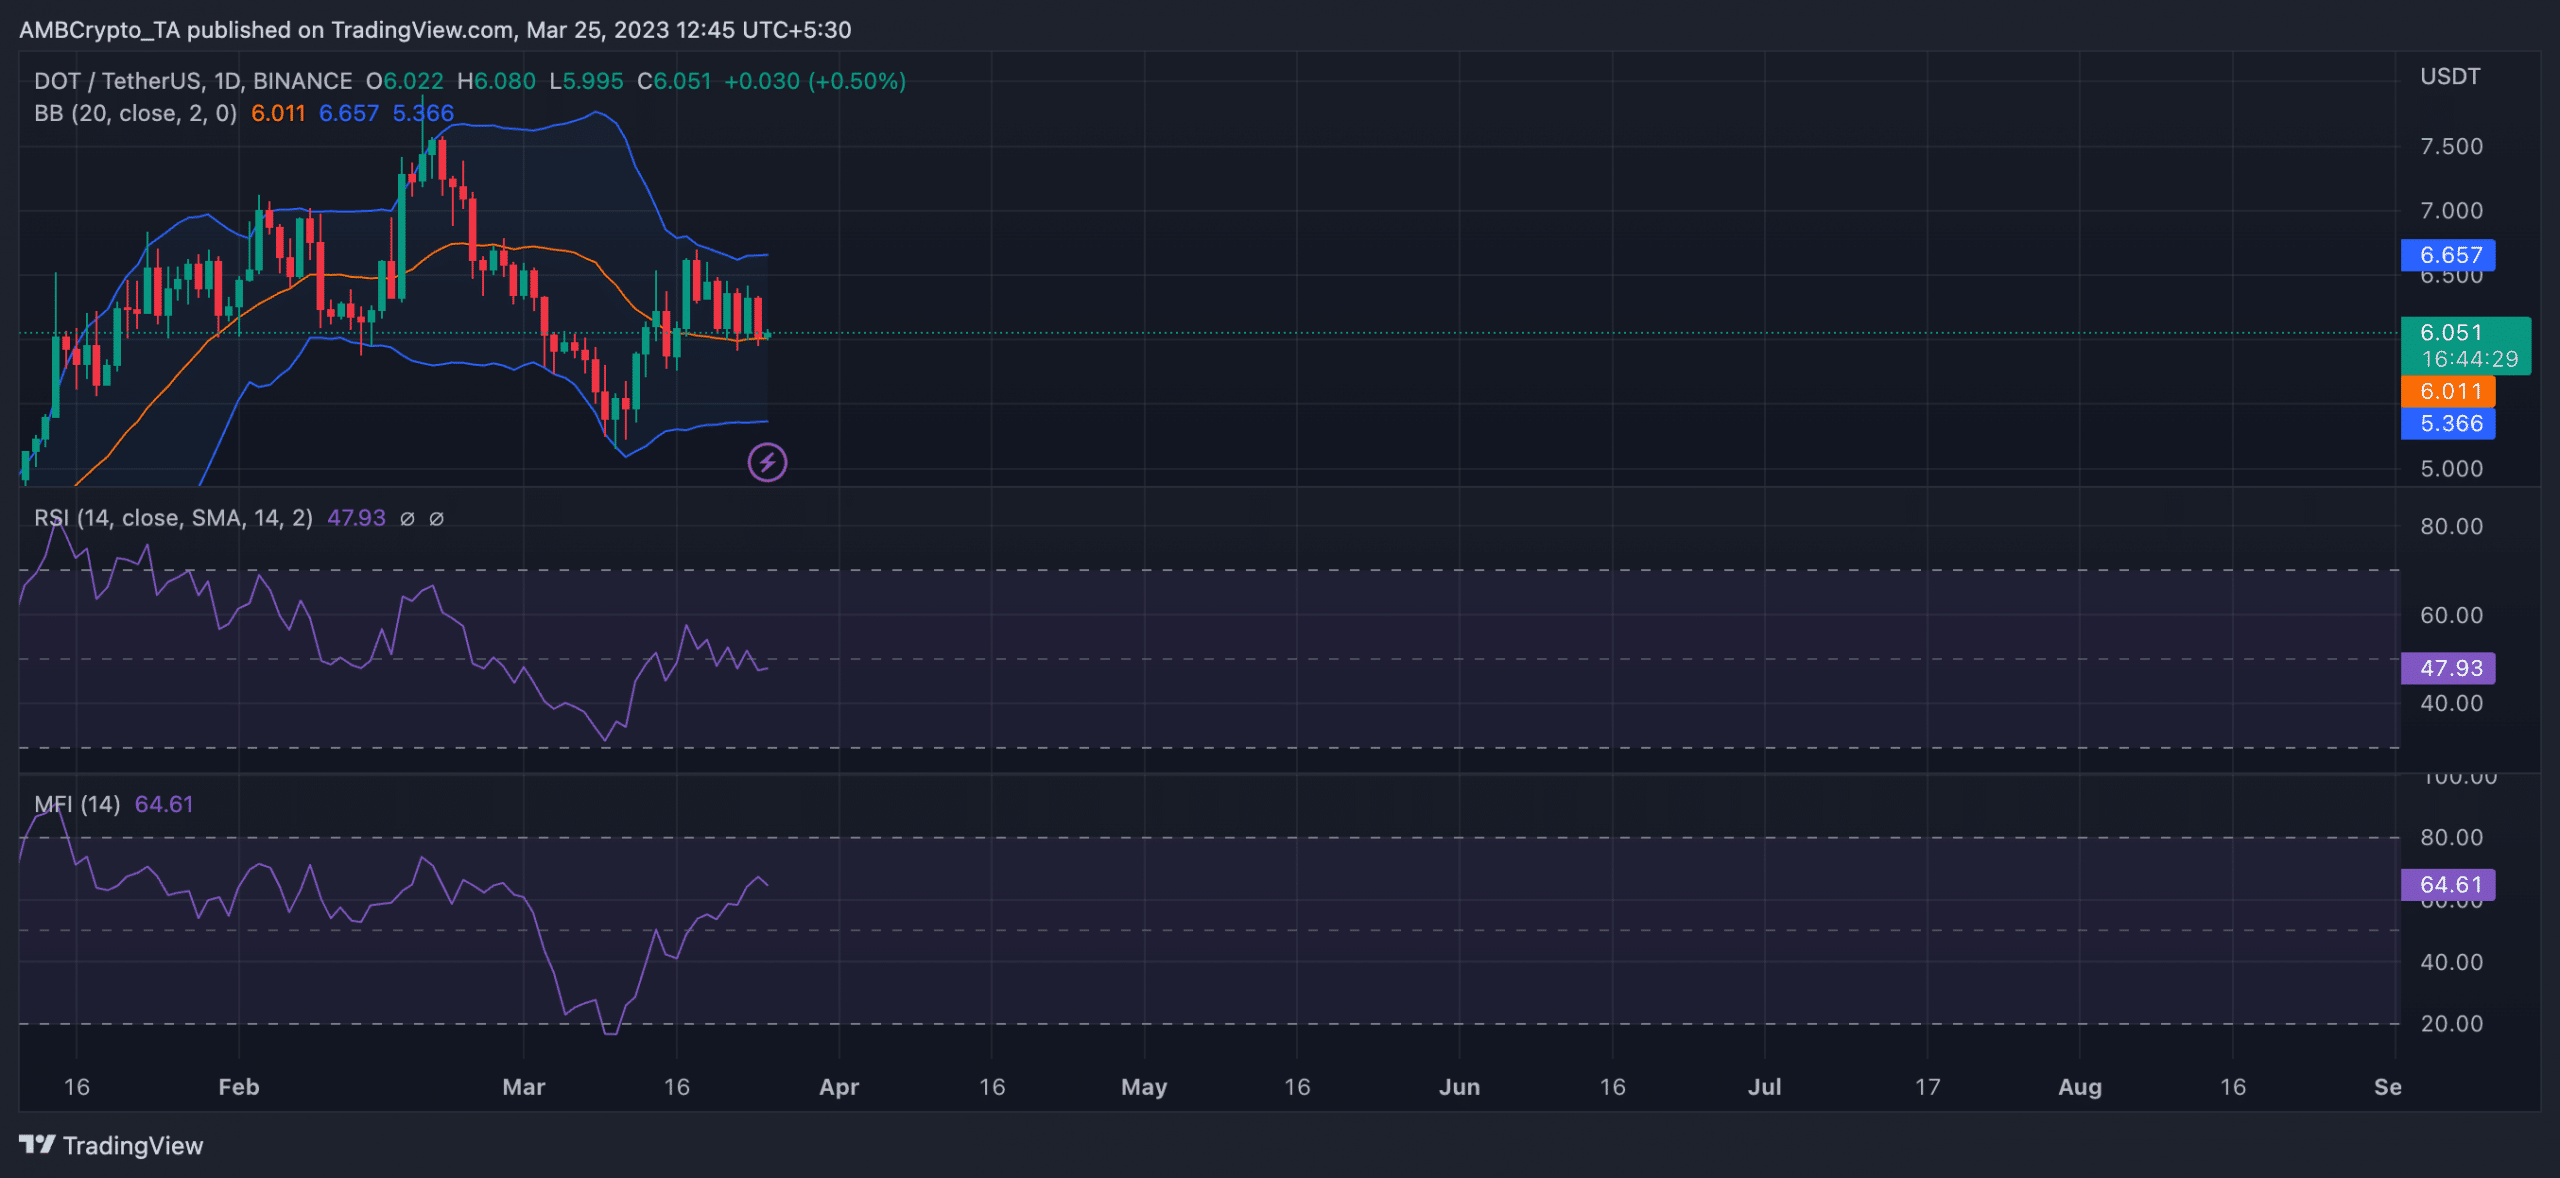
An assessment of DOT’s movement on a daily chart revealed severe price volatility in the first 19 days of March. However, in the last week, investors appeared to have stayed their hands as many remain unsure of the coin’s next direction.
Since 20 March, DOT’s price was at the middle line of the Bollinger Bands indicator, and remained so at press time. When the asset’s price is on the middle line of the Bollinger Bands, it indicates that the asset’s price is in a neutral position, and there is no clear trend in either direction. It is generally considered a “wait-and-see” situation for traders and investors until there is a clearer signal of where the asset’s price is heading.
Realistic or not, here’s DOT market cap in BTC’s terms
While DOT’s price oscillated within a narrow range in the last week, its Relative Strength Index (RSI) has dipped, while its Money Flow Index (MFI) embarked on an uptrend. This suggested that some buying activity was underway despite the decline in RSI.
However, the neutral price action indicates that the market remains uncertain about the asset’s direction.


