
The cumulative market cap of the cryptocurrency sector was $1.57 trillion at press time, having fallen by 2.39 percent since yesterday. The market’s alts were falling too, with the likes of Polkadot, EOS, and IOTA seeing red on the charts. While Polkadot continues to maintain its position in the top 10, EOS was ranked 27th while IOTA was ranked 40th.
Polkadot [DOT]
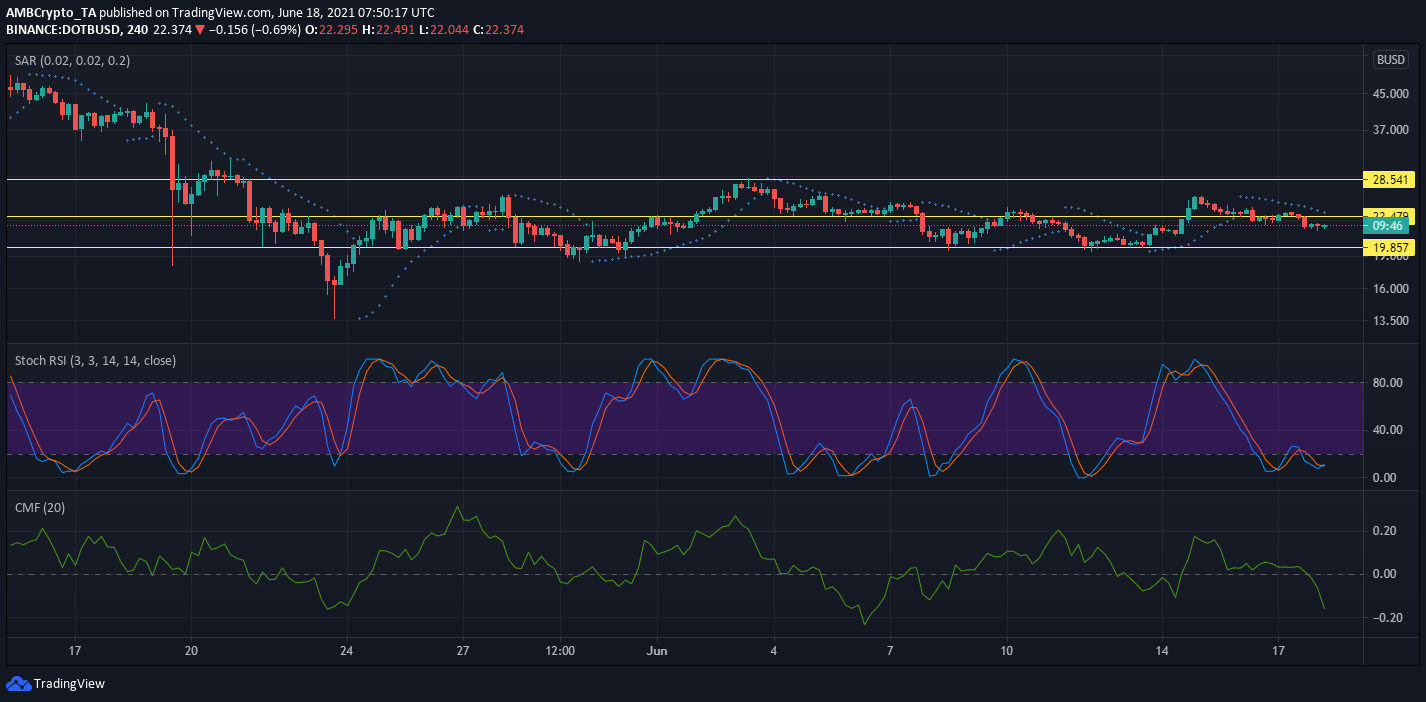
Source: DOT/BUSD – Trading View
DOT fell from a recent high of $26 to $22.34, its price at press time. Its 24-hour trading volume was down by 31.28 percent at $1 billion. Its price dropped by 6.3 percent in just 24 hours.
The coin has not dipped below the $20-resistance mark since the beginning of this month. However, after climbing to a high of $28.5 on 3 June, the alt’s price went sideways and did not cross the lower high of $26. There may be a further dip in the price, as evidenced by the findings of the Parabolic SAR.
The Stochastic RSI at the lower end, below 20, suggested that the prices may rise, however, following a reversal. Finally, the Chaikin Money Flow was below zero and pointed to high capital outflows and the likelihood of a further drop in price.
EOS
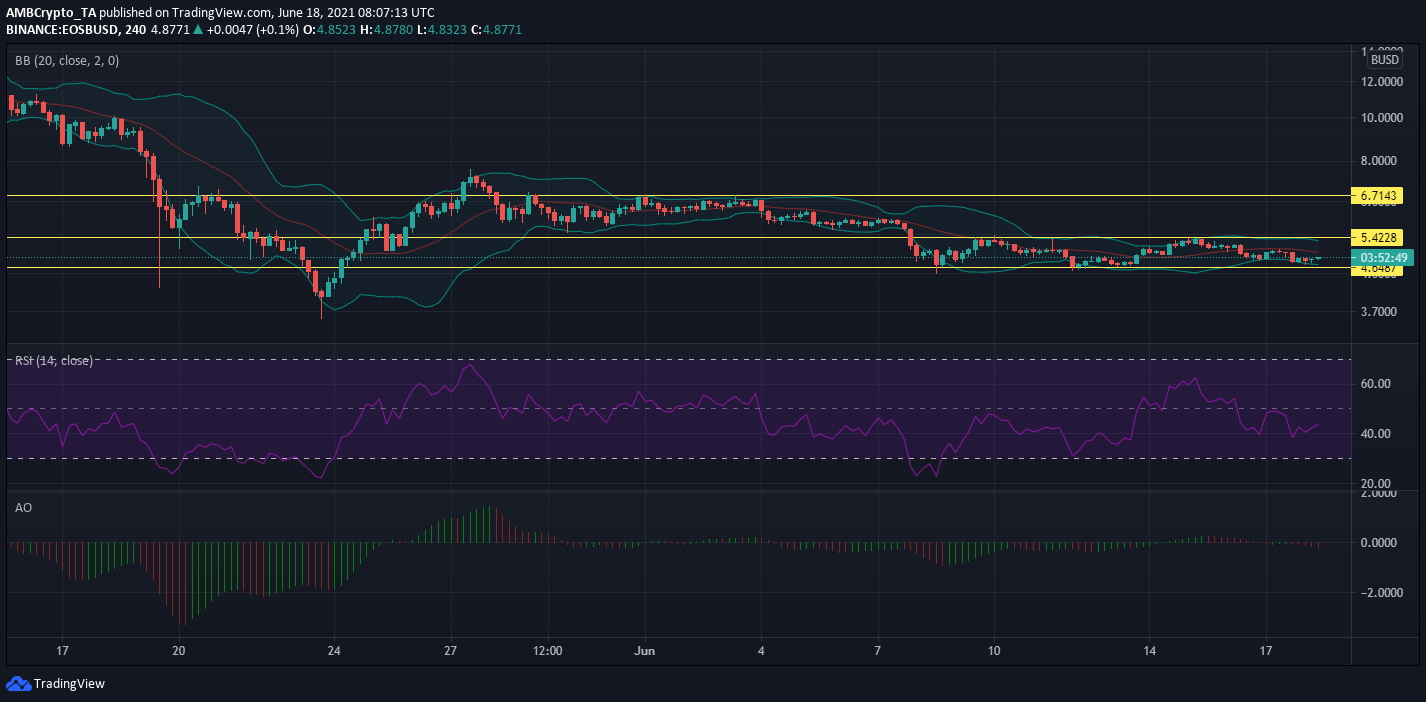
Source: EOS/BUSD – Trading View
Even though EOS had made a decent recovery toward the end of May, it slumped again from a high of $7.7. Its price continued to drop today, dipping by 3.8 percent.
Consolidating between the $4.4 support and $5.4 resistance since 8 June, the coin was changing hands at $5, at the time of writing.
The parallel Bollinger Bands showed no signs of volatility and dominant bearish momentum was displayed by the Awesome Oscillator. The Relative Strength Index indicator was moving upwards, indicating growing buying pressure.
IOTA
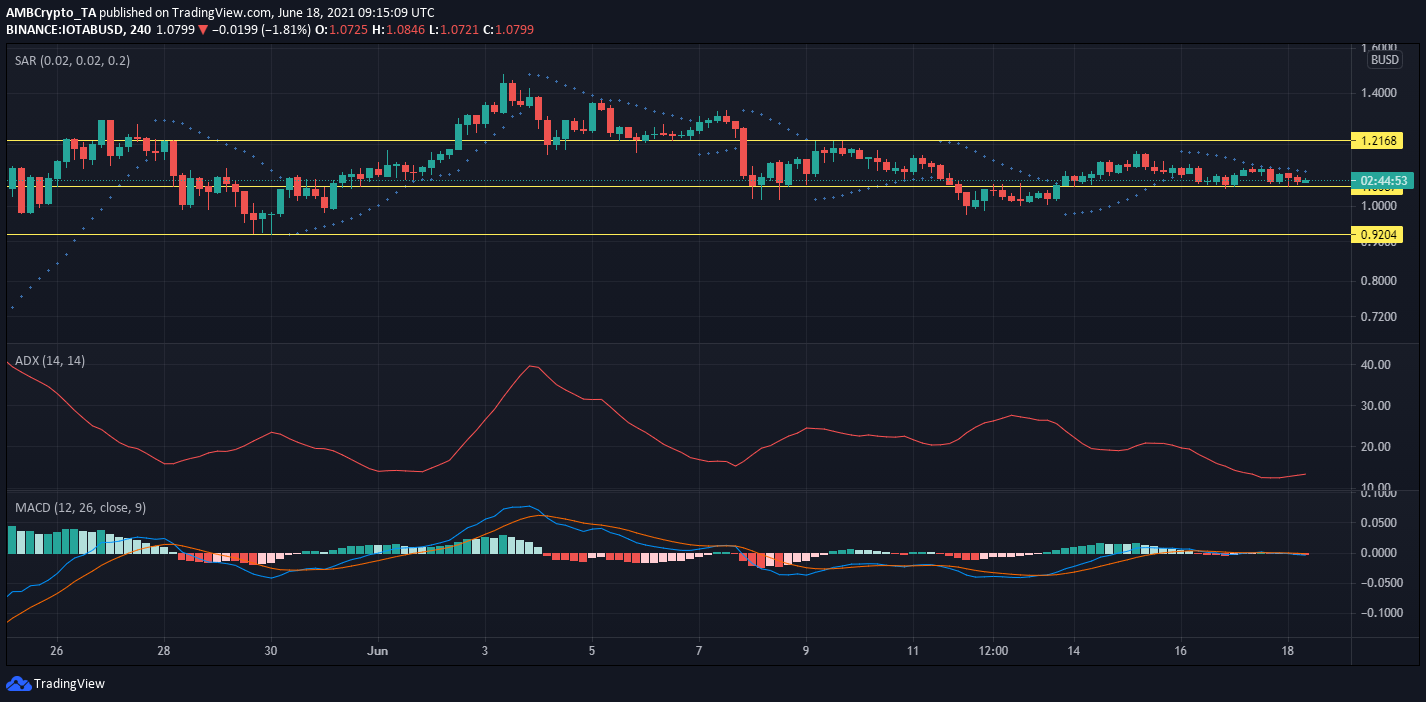
Source: IOTA/BUSD – Trading View
After a significant drop from $ 1.2 a few days ago, IOTA was still trading in the red after dropping by 3.6 percent in the last 24 hours. At $31 million, its 24-hour trading volume had dropped by 28.29 percent.
Over the last ten days, its price did not breach the $ 1.2-resistance mark. However, a new support level was established after 13 June. With the indicator below the 20-mark, the Average Directional Index pictured a weak trend which may strengthen in the future, going by its movement.
The MACD and Signal lines were meeting and neither a bearish nor bullish trend was established. The Parabolic SAR’s markers were found above the candlesticks and pointed to an upcoming dip.