Polkadot, EOS, VeChain Price Analysis: 22 December

Polkadot bounced off the $4.8 support to reach $5 but bears still appear to have the upper hand in the short-term. EOS was set to retrace all its recent gains due to heavy selling over the past couple of days. VeChain broke to the downside of an ascending triangle pattern and could post further losses in the coming days.
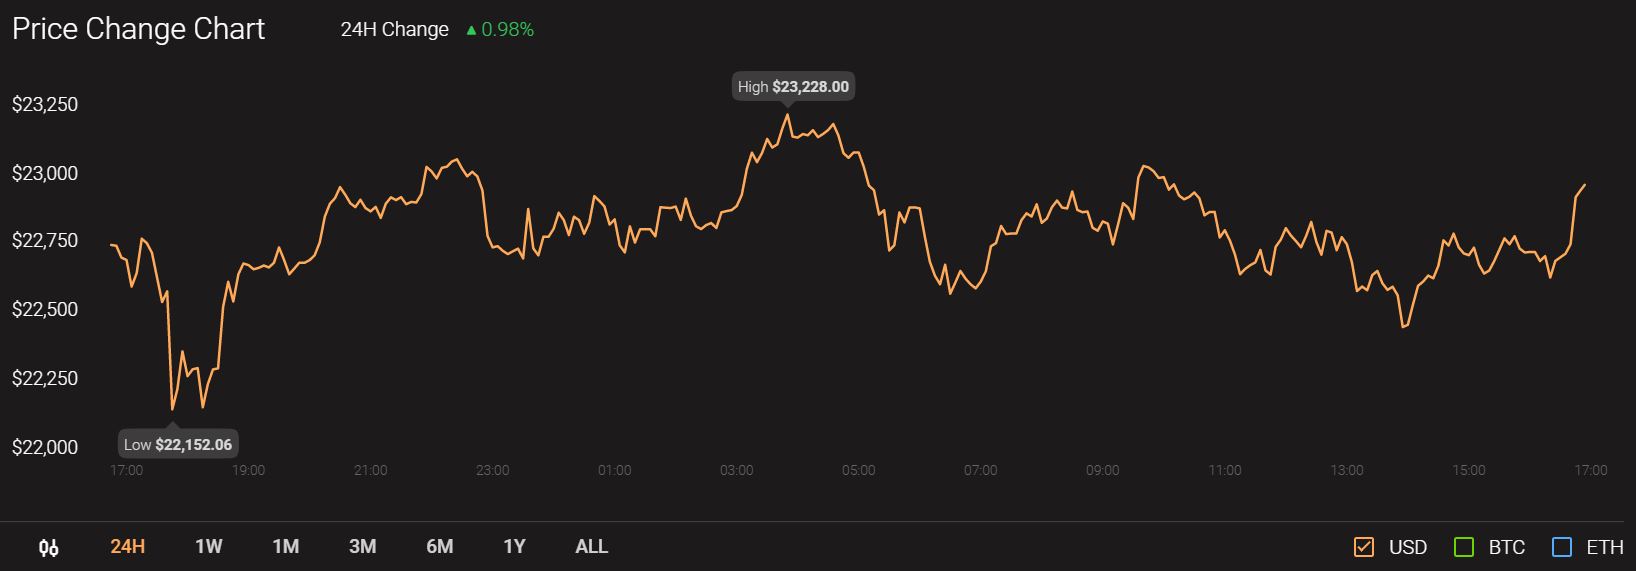
However, for Bitcoin, the past 24-hours saw a minor increase in trading value of under 1 percent. The coin currently trades at $22,958 with a market cap of $426.5 billion.
Polkadot [DOT]
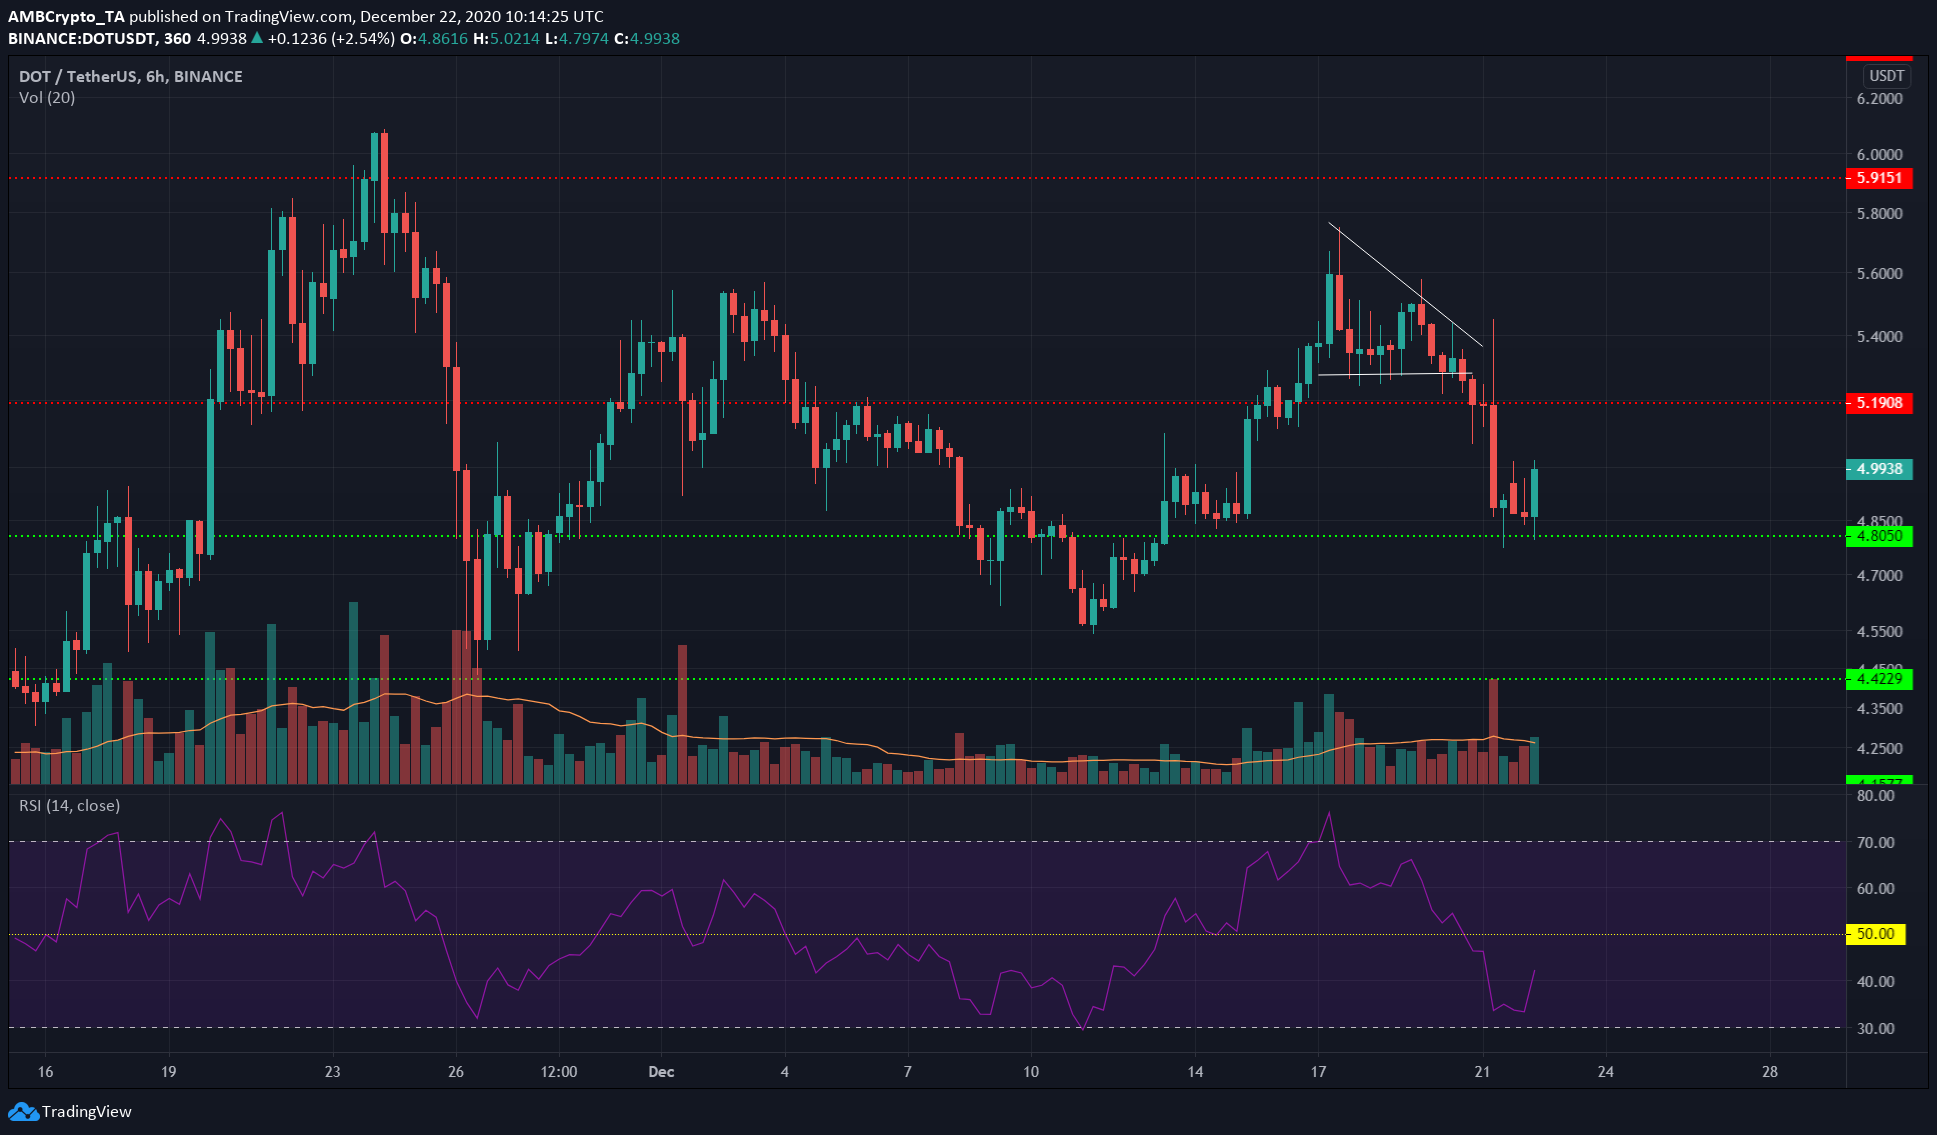
Analyzing the 6-hour chart, DOT has formed a descending triangle pattern. While this pattern generally sees a bullish breakout, in this instance DOT was forced downward and pushed beneath the $5.19 level of support.
It was trading at the $5 level after it hit the $4.8 support level, but the RSI has climbed to 44 from a value of 33 a few hours ago. This development did not signal a reversal in bearish pressure, however.
The most recent green candle has a good trading volume to it, and it remains to be seen whether bulls can wrest back control of the $5.19 level.
EOS
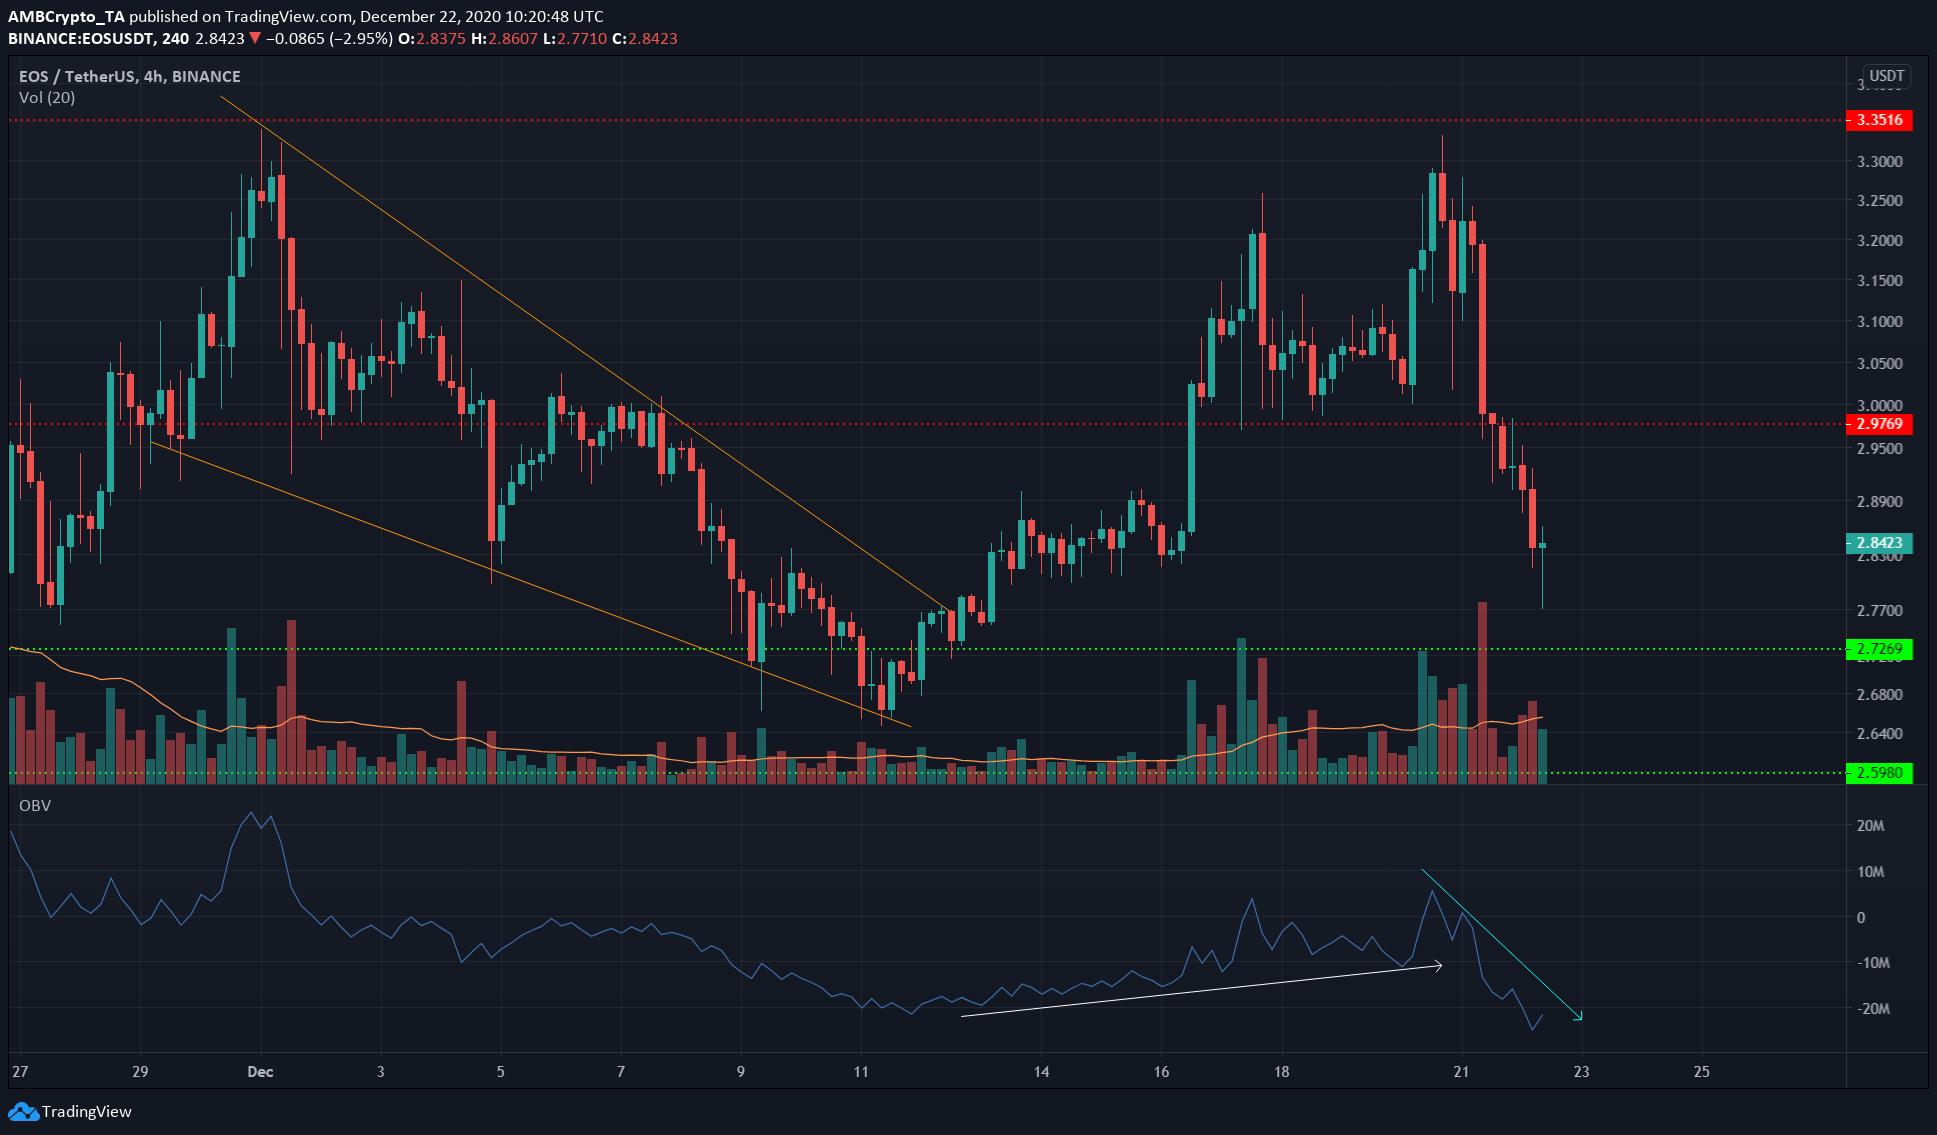
After the breakout from the bullish reversal pattern, the falling wedge (orange), the OBV showed a steady climb in buying volume as it registered a series of higher lows.
This steady gain in price and buyers were undone almost overnight as both the OBV and the price dived due to the recent wave of selling.
The $3 level which had been flipped to support was once more in bearish hands, and EOS was headed back lower, to a level of support at $2.72.
VeChain [VET]
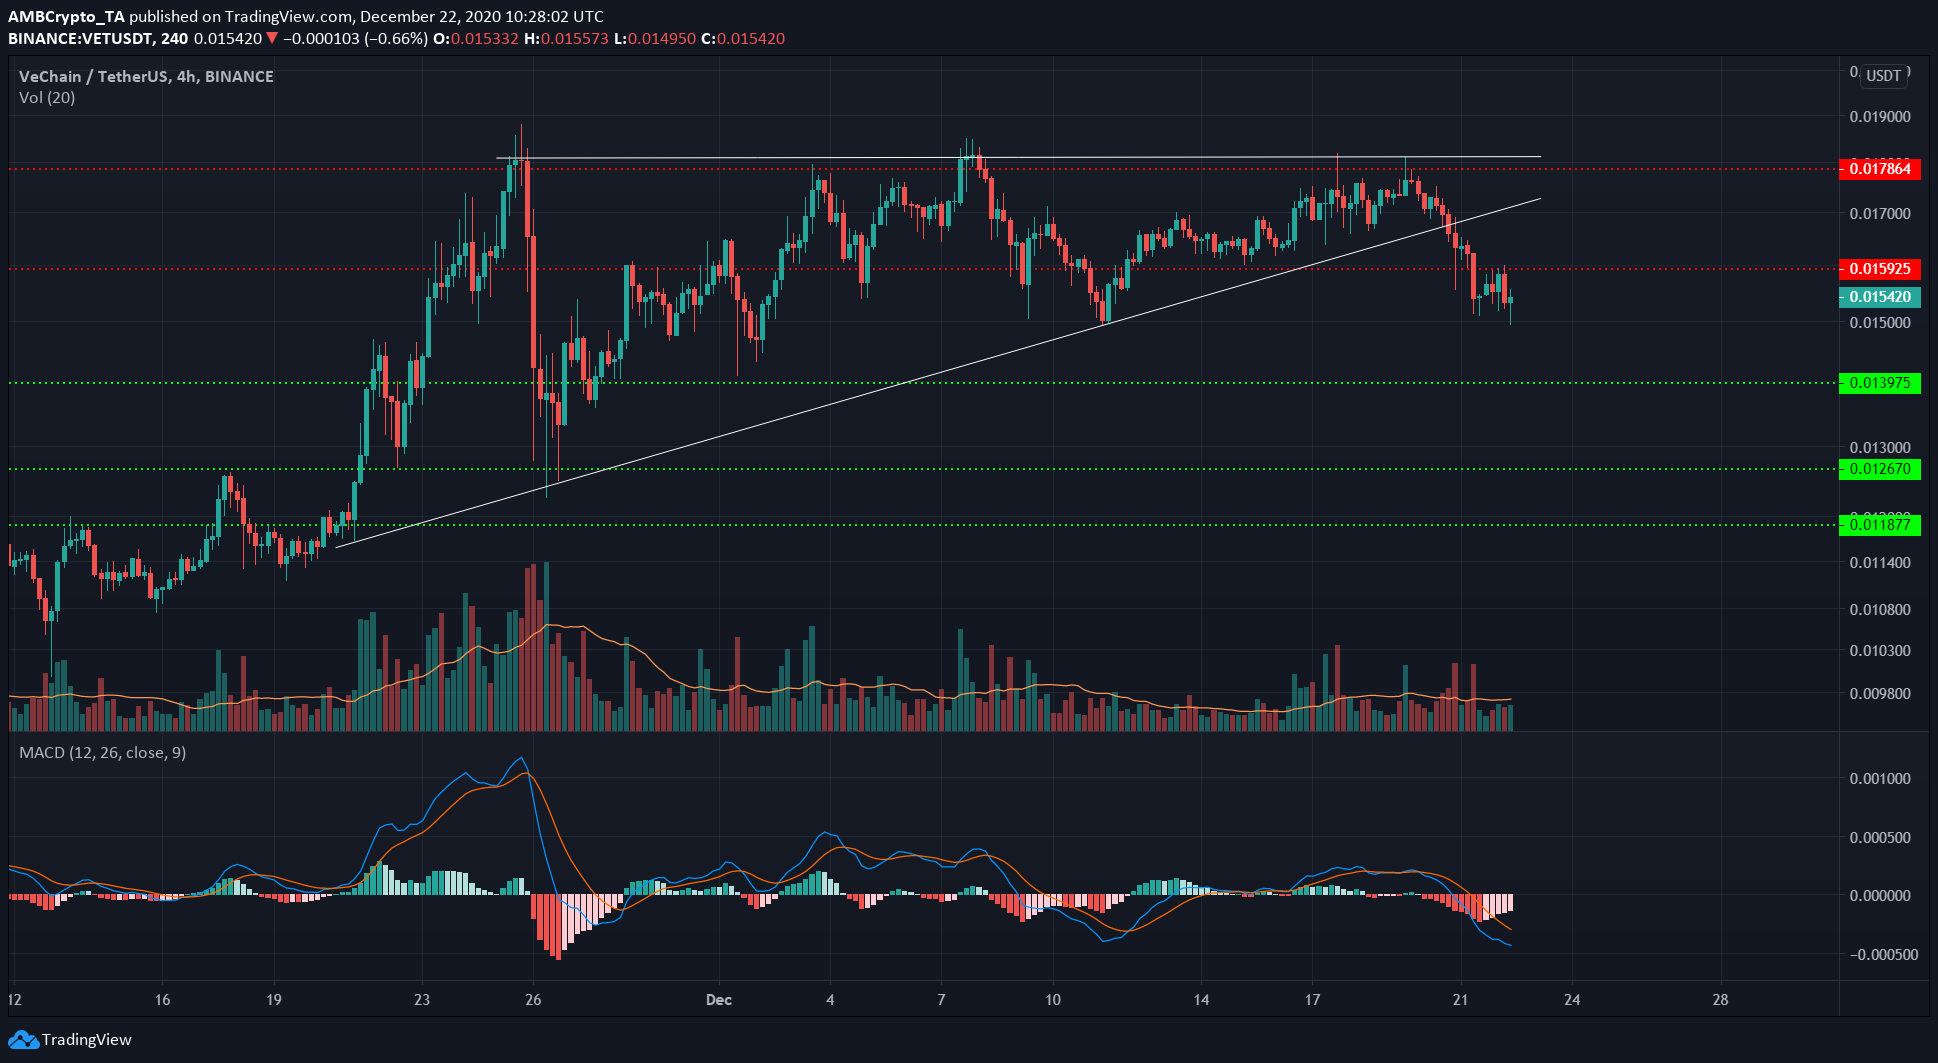
VET formed an ascending triangle pattern and closed a trading session beneath the pattern on strong trading volume to affirm a move to the south.
Subsequently, VET lost the $0.0159 level of support and retested it as resistance, and was trading at $0.0154 at the time of writing.
The $0.015 region could halt the bears momentarily, but based on both the short-term bearish momentum as well as the triangle pattern the price broke out of, it was likely that VET would face further losses over the coming days.
The MACD dived beneath the neutral line to highlight bearishness.


