![Polkadot’s [DOT] good days are far from over, thanks to these metrics](https://ambcrypto.com/wp-content/uploads/2023/01/DOT-3.png.webp)
- Polkadot was only behind Polygon in terms of revenue performance last week.
- Metrics and market indicators supported the bulls.
Polkadot [DOT] recently made it to the headlines, not for its development activity, but this time for revenue. It ranked second on the list of top blockchains in terms of revenue performance in the last seven days. The network nabbed the first spot while Solana sat in the third spot on the list.
#Polkadot was ranked #2 in the revenue performance in comparison to many other popular chains last 7D ?
Besides, below are the top 10 chains with the most productive revenue presentation, but only 8 out of 10 are positive. Let's see closer for details ?@Polkadot #DOT $DOT pic.twitter.com/IsnnHKmRLx
— Polkadot Insider (@PolkadotInsider) January 13, 2023
Polkadot Insider also released its on-chain data on 12 January, which revealed quite a few important stats about the ecosystem. For instance, the total number of finalized blocks reached 13.8 million, and total transfers were about to reach 10 million.
Moreover, the number of holders also crossed one million, which looked optimistic for the blockchain.
The on-chain data tells the truth, so today let's look at the on-chain of top projects in the @Polkadot ecosystem.
It includes:
?Finalized Block
?Signed Extrinsic
?♀️Transfers
?Holders
? Total InsuranceMore detail below ?#Polkadot #DOT $DOT #ASTR #ACA #GLMR #PARALLEL pic.twitter.com/FQdJJu4LPI
— Polkadot Insider (@PolkadotInsider) January 12, 2023
Read Polkadot’s [DOT] Price Prediction 2023-24
A commendable performance
DOT’s performance on the price front was also in investors’ favor as it registered double-digit gains in the last week, thanks to the ongoing bullish market. CoinMarketCap’s data revealed that DOT’s price increased by 13% during the last week, and at the time of writing, it was trading at $5.23 with a market capitalization of over $6 billion.
A look at DOT’s on-chain metrics suggested that the price hike did not happen just because of the market condition, but that several factors were at play. DOT’s Binance funding rate remained consistently high in the last seven days, reflecting its demand in the derivatives market.
Positive sentiments around DOT also remained relatively high last week, indicating the community’s trust in DOT. As per LunarCrush, DOT’s volatility increased considerably, increasing the chances of a continued uptrend in the days to follow.
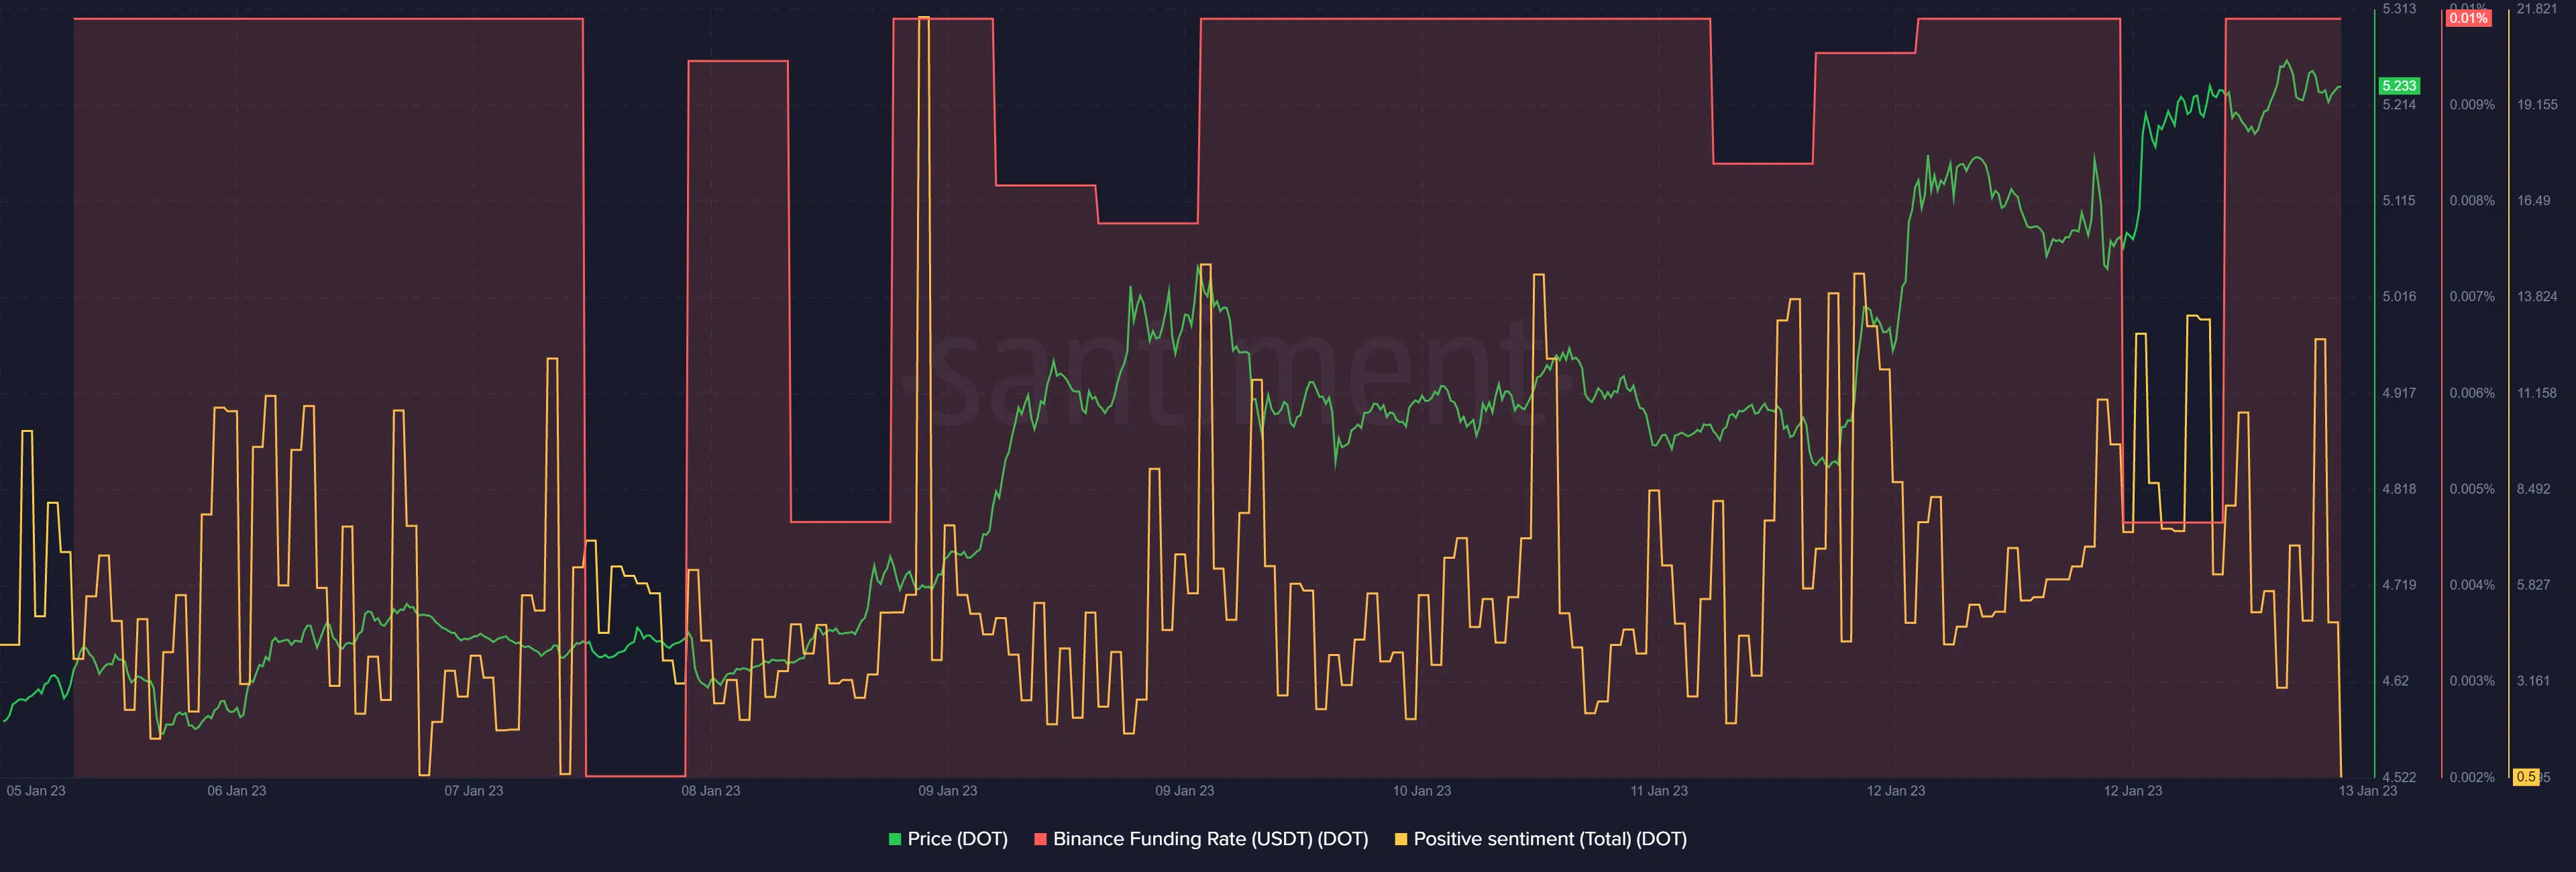
Source: Santiment
Realistic or not, here’s DOT’s market cap in BTC’s terms
What should Polkadot investors expect?
DOT’s market indicators gave a bullish notion, as most of them suggested that the uptrend will sustain itself in the coming days. The MACD revealed a massive bullish upper hand in the market. DOT’s Chaikin Money Flow (CMF) was also substantially above the neutral mark.
According to the Exponential Moving Average (EMA) Ribbon, the 20-day EMA was fast approaching the 55-day EMA, increasing the chances of a bullish crossover. Moreover, the Bollinger Band revealed that DOT’s price entered a high volatility zone, further increasing the chances of a continued price surge.
However, DOT’s Money Flow Index (MFI) was in the overbought zone, which might be concerning for investors.
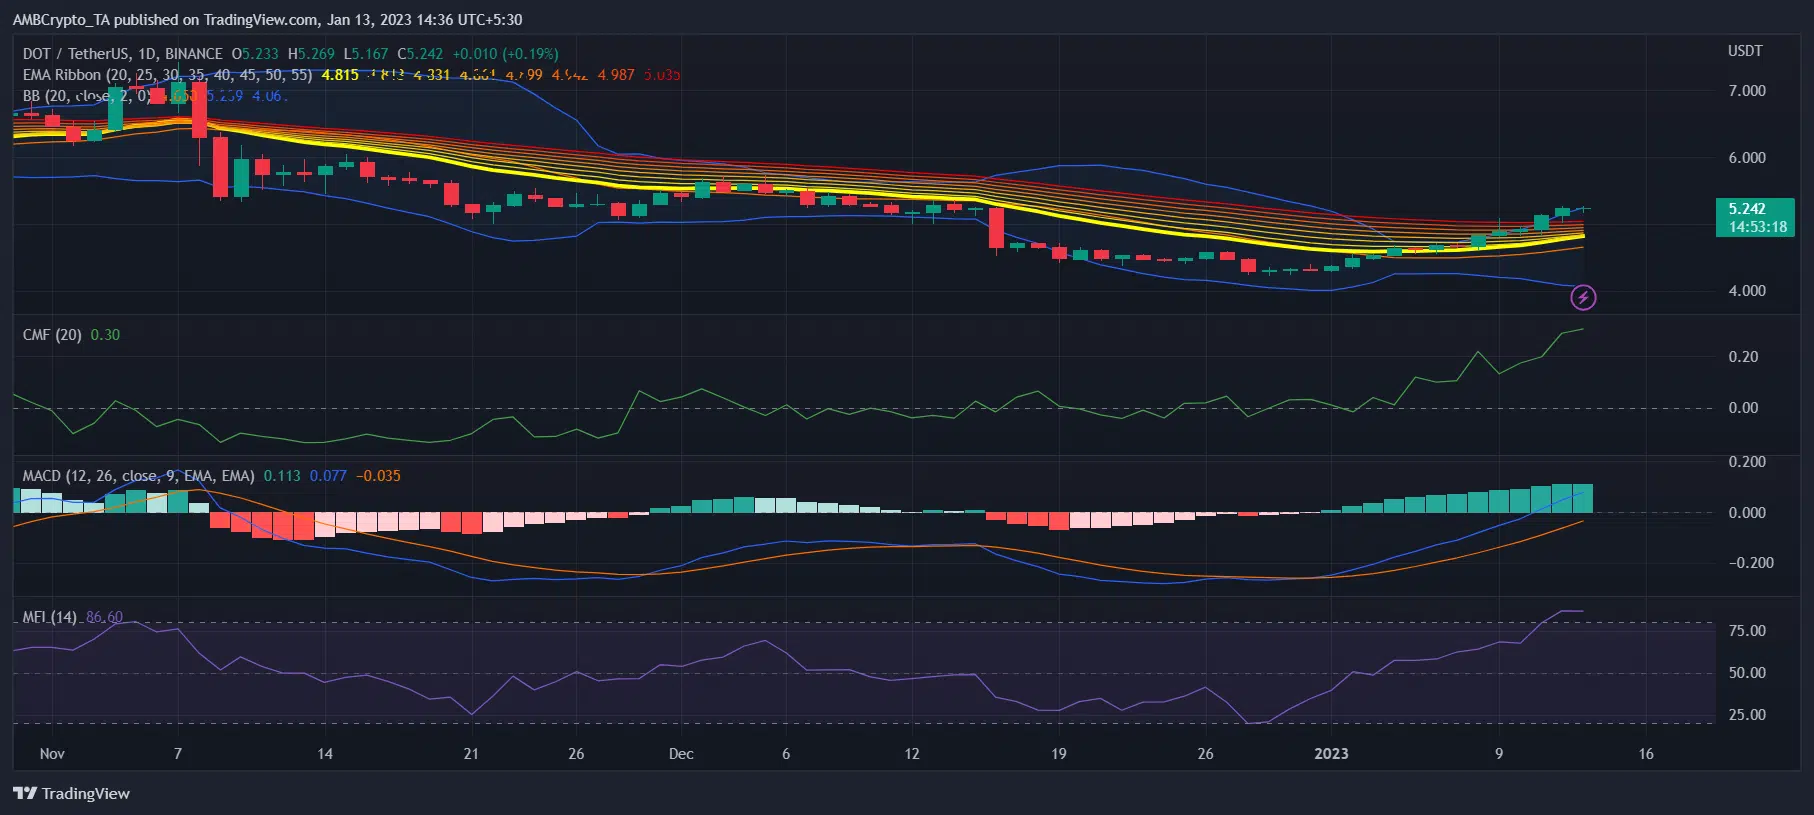
Source: TradingView