
Polkadot showed a lack of momentum after a breakout past range highs and would look to hold on to the $20 level. IOTA was strongly bullish as its recent dip to $0.56 was bought up. Crypto.com Coin showed initial signs of a move down to $0.062.
Polkadot [DOT]
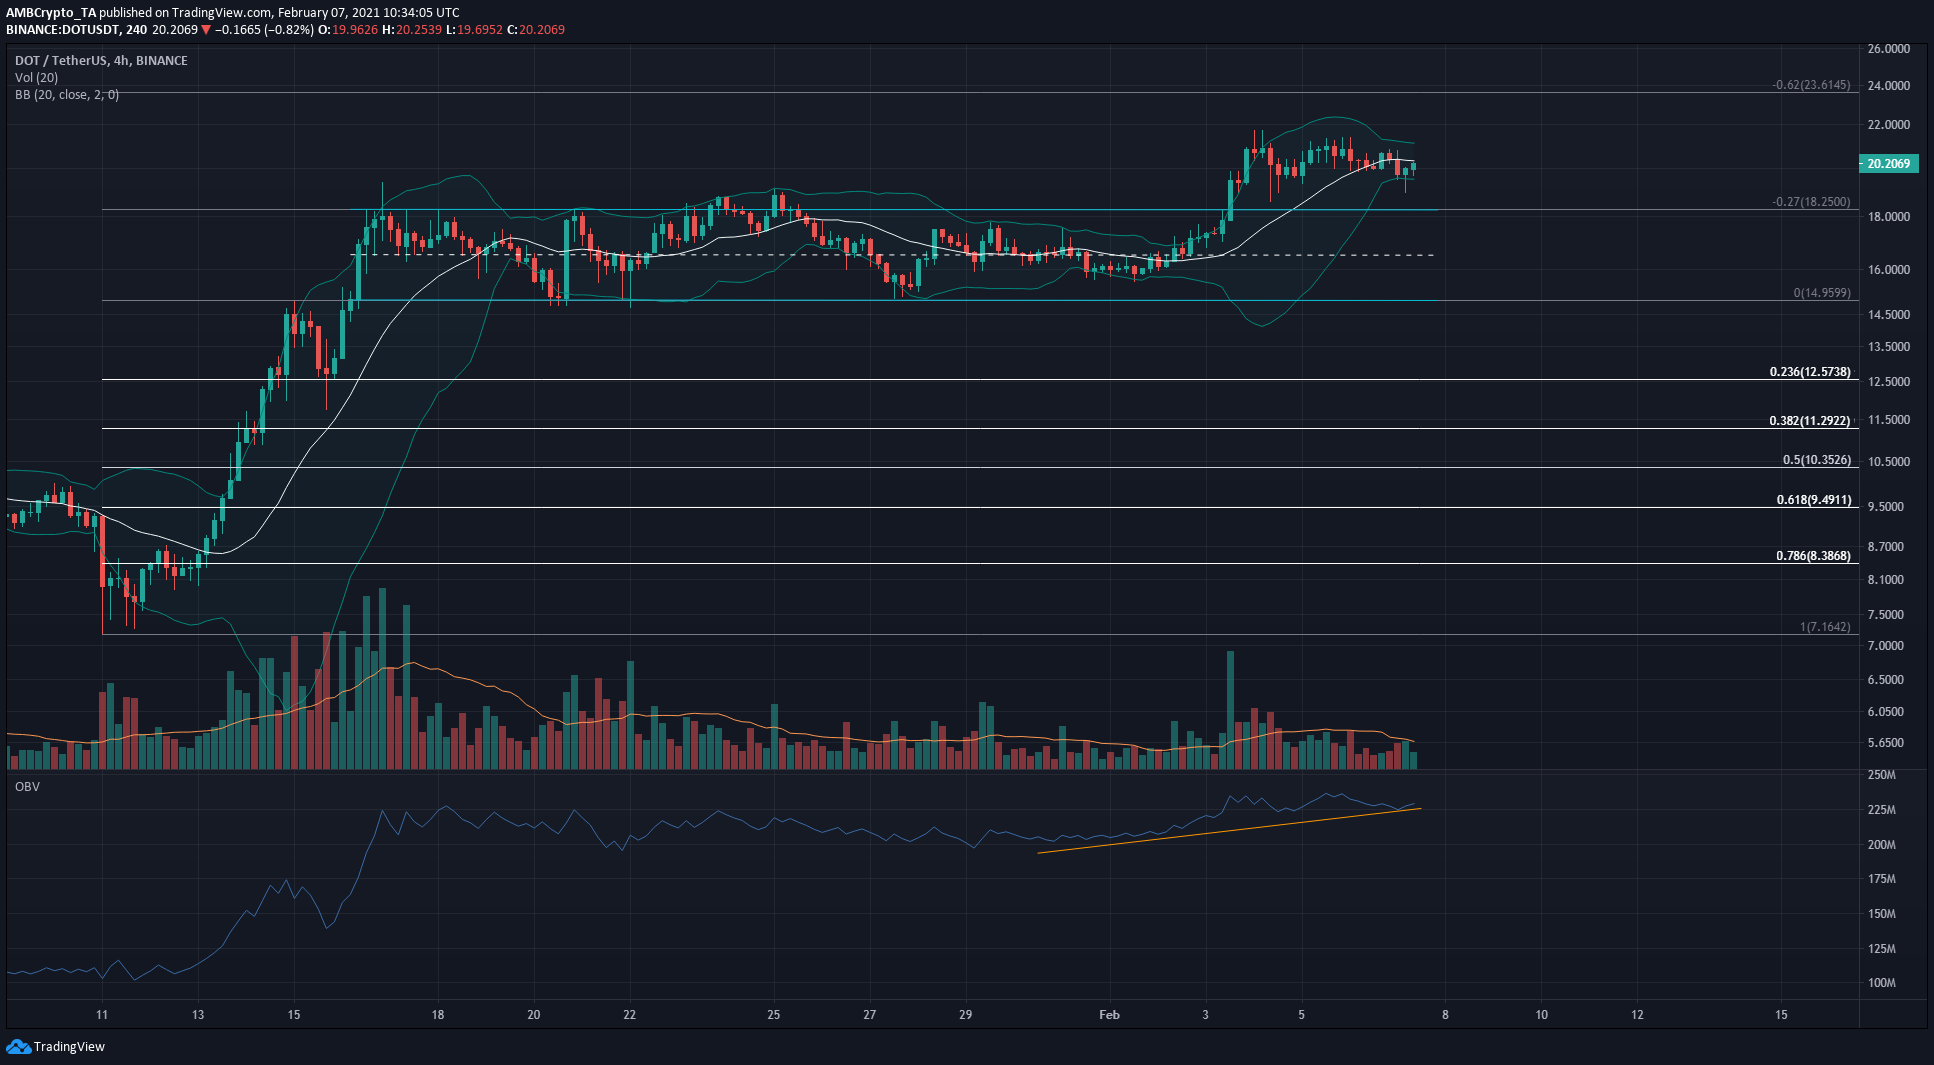
Source: DOT/USDT on TradingView
The Bollinger bands tightened around DOT despite a seeming break out of a range between $14.96 and $18.25. This development hinted at consolidation for DOT in the vicinity of the $20 mark.
A pullback to $18 looked unlikely at the time of writing- the OBV notes a series of higher lows formed over the past week. This buying volume, combined with a lack of momentum in recent days, hints at further consolidation and not a drop.
The next level of significance is the $23.6 level, which represents a 62% extension for DOT. Support lies at $18.25 for DOT.
IOTA
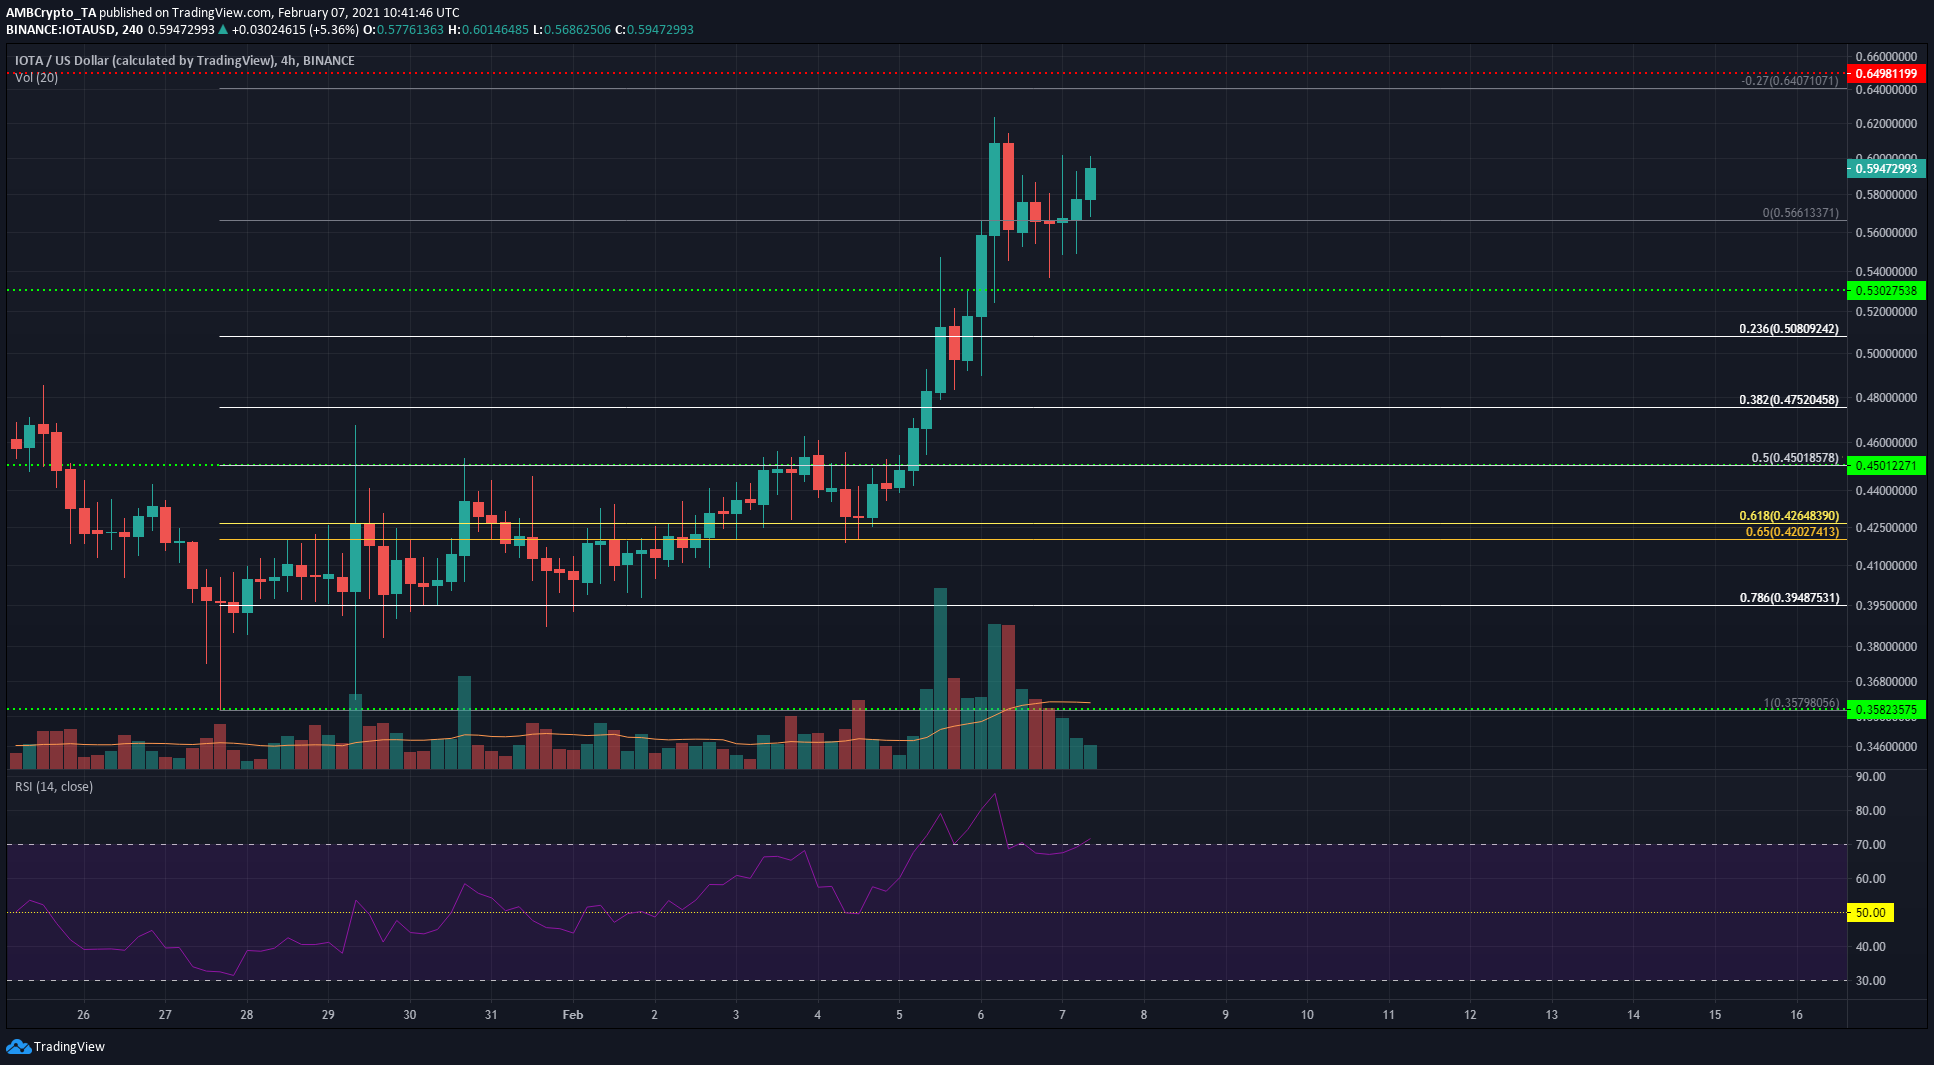
Source: IOTA/USD on TradingView
The Fibonacci retracement tool highlighted areas of support for IOTA after its strong rally from $0.358. The confluence of these retracement levels with historic levels of support lends credence to the projected 27% extension of this move for IOTA.
The aforementioned extension level presents a bullish target of $0.64, with $0.65 expected to act as a level of resistance at well. The momentum was strongly bullish, as shown by the RSI. A pullback from $0.61 to $0.56 has already been seen for IOTA, and it has initiated its recovery from the dip as well and was trading at $0.59 at the time of writing.
Crypto.com Coin [CRO]
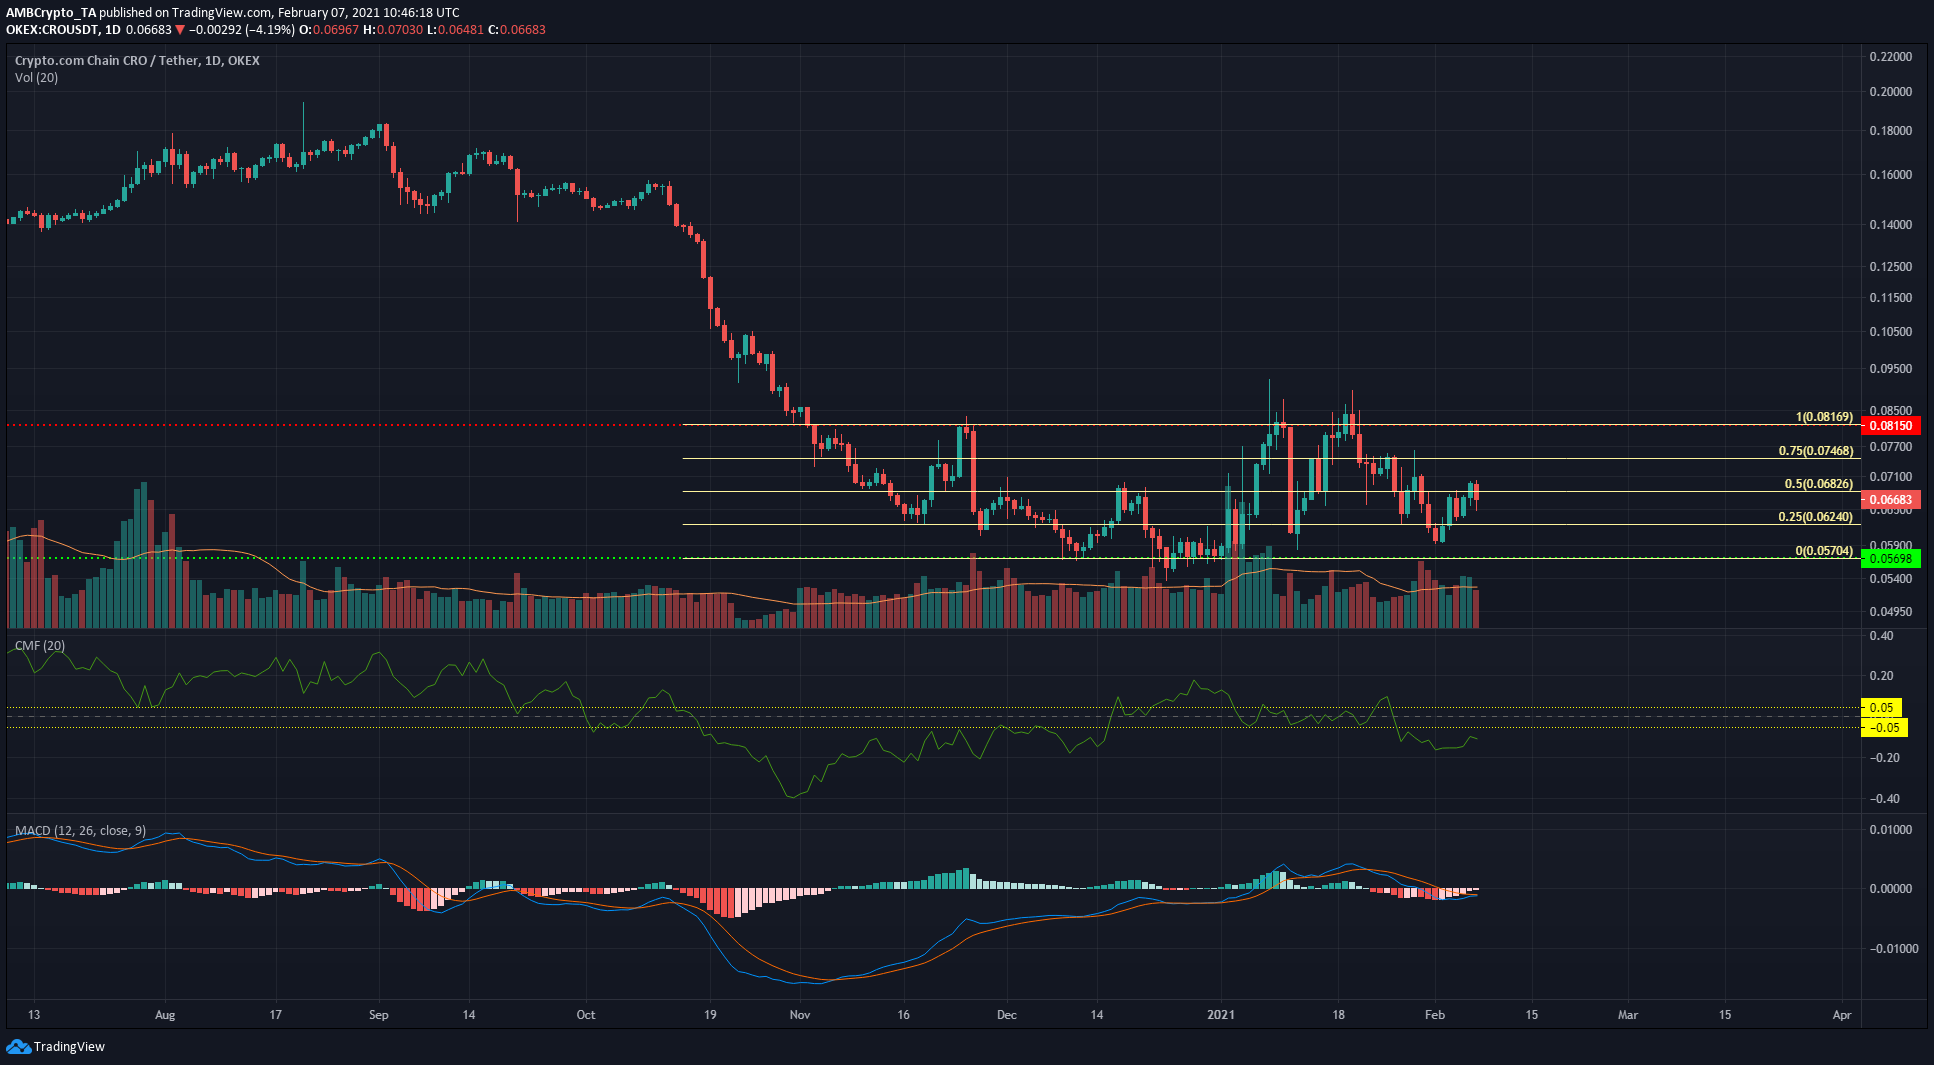
Source: CRO/USDT on TradingView
Using the 1-day timeframe to analyze Crypto.com Coin, it can be seen that the downtrend from early September has been halted. CRO formed a rectangle bottom pattern as it traded within a range following a significant downtrend.
The Chaikin Money Flow showed net capital flow out of the market, highlighting seller dominance. The MACD was beneath the zero line, and was right atop the signal line.
Looking to the price action for further clues, it can be seen that the 50% level of the range is at $0.068. CRO attempted the climb above it, but the past 24 hours has seen it being pushed lower. A rejection from the 50% level is significant and hints at further bearish pressure that could take CRO to $0.062.


