
Polkadot’s break above the $46.5-resistance level was backed by strong buying pressure, but volumes needed to be observed for a sustained rally. IOTA needs to rise above its 200-SMA and the $2-mark to initiate a recovery. Finally, Ethereum Classic can be projected to move sideways between $116.8 and $78.1 while awaiting cues from the broader market.
Polkadot [DOT]
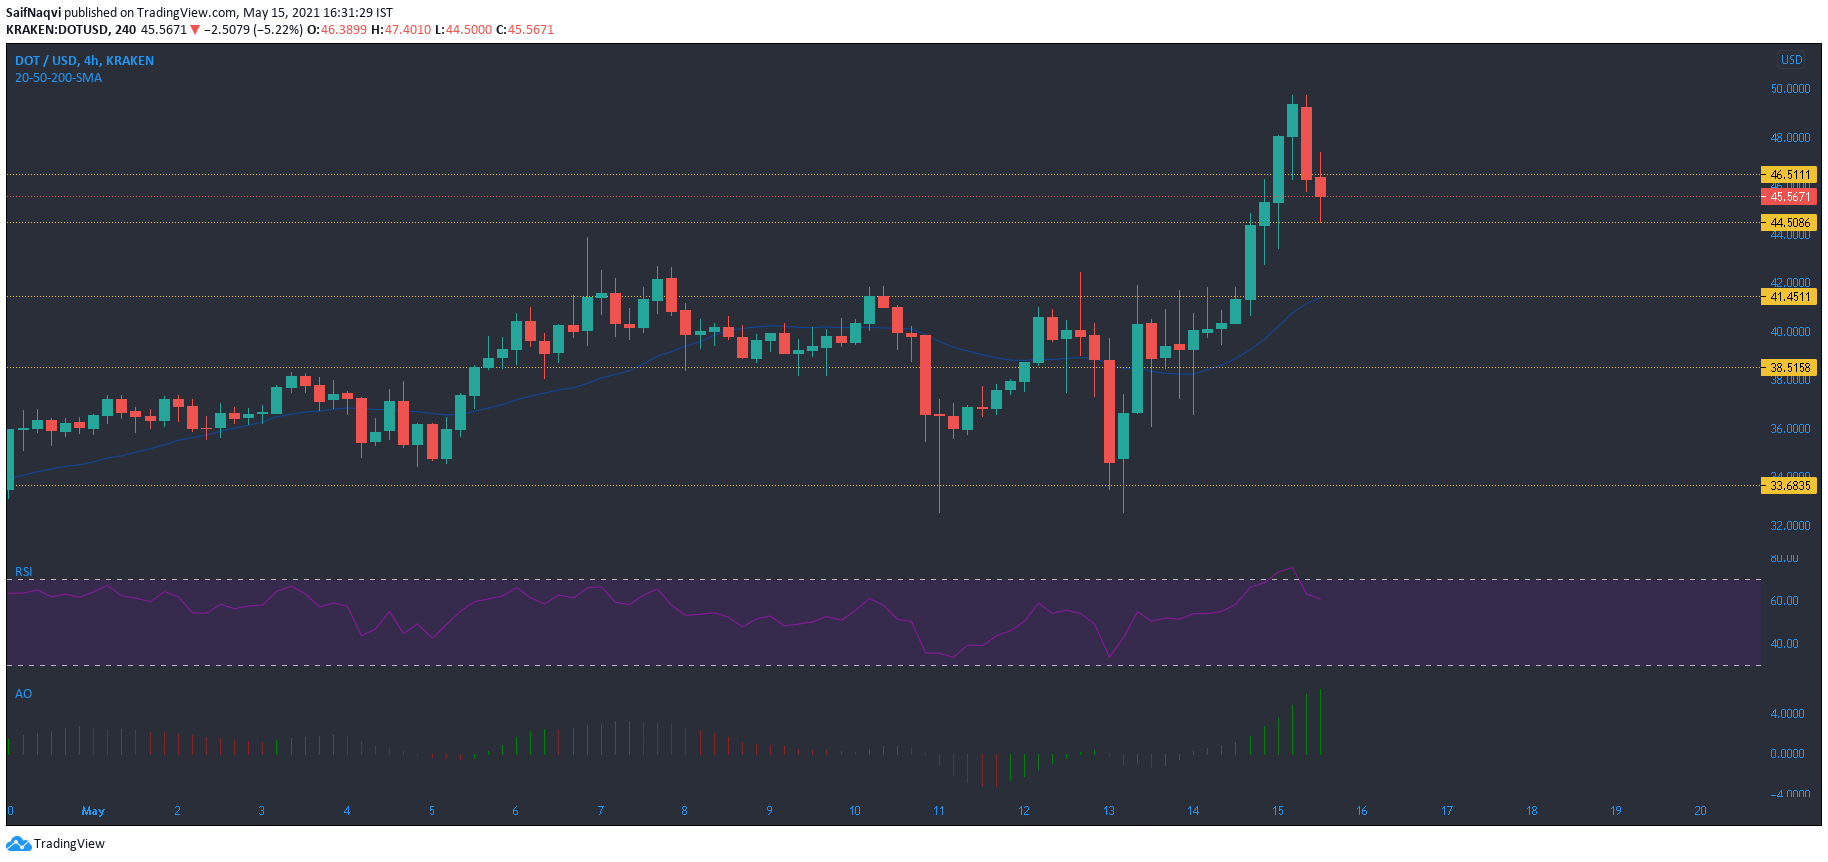
Source: DOT/USD, TradingView
Polkadot’s hike above $46.5 was backed by relatively higher volumes, but weakening signs suggested a minor dip before the next upswing. The RSI showed overbought conditions and fell sharply over the past few sessions. A region of support lay around the $44.5-mark, but it was yet to establish itself as a reliable buy zone. A more rigid line of defense lay between $41.4-$42.5 – a region that coincided with the 20-SMA. If losses are maintained at $44.5, a swift bullish response can be expected over the next few hours.
Meanwhile, volumes must be observed for more clarity on DOT’s short-term trajectory. Higher trading activity would support a price hike. According to the Awesome Oscillator’s green bars, momentum still rested with the buyers.
IOTA
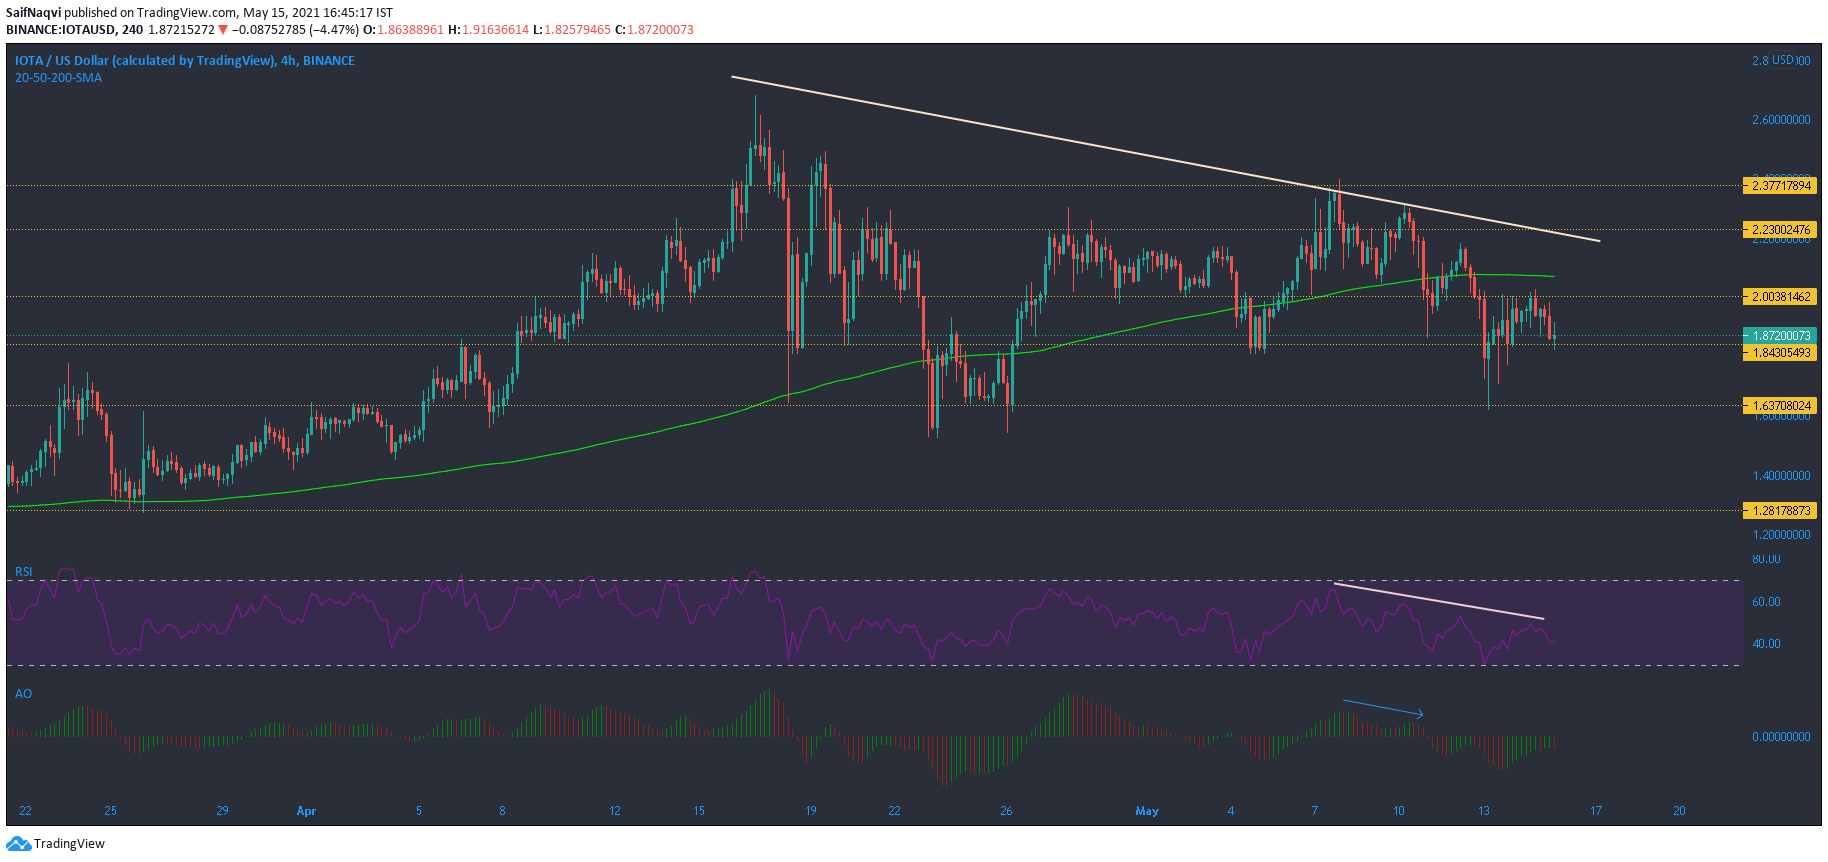
Source: IOTA/USD, TradingView
IOTA’s bearish movement was evident on the 4-hour timeframe, but the candlesticks lay above the crucial support zone of $1.63. Although IOTA maintained itself below its 200-SMA (green), the market bulls have been quick to respond during previous pullbacks. However, the technicals pointed to an additional weakening in the market. The RSI’s lower highs confirmed a strong bearish trend as the cryptocurrency moved south from $2.39.
A bearish twin peak on the Awesome Oscillator also saw it move below the half-line and despite periods of bullish momentum, IOTA did not make a case for recovery just yet. A hike above the upper sloping trendline would be a step in the right direction, but the bulls have to enforce a break above the long-term moving average before talks of a bounceback.
Ethereum Classic [ETC]
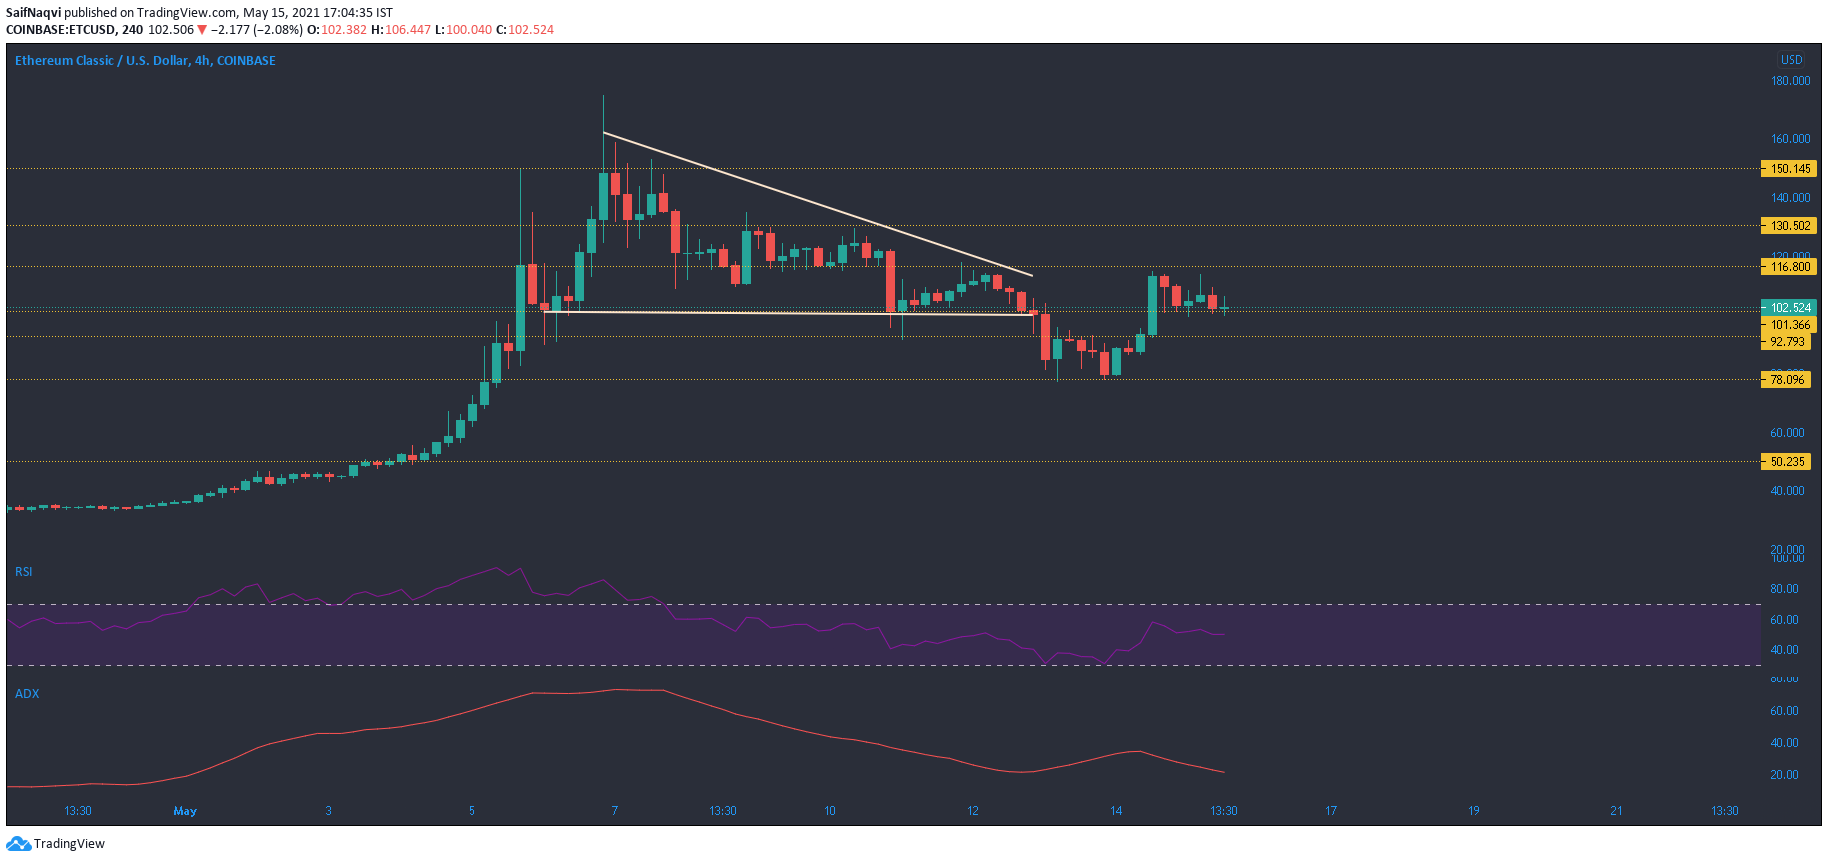
Source: ETC/USD, TradingView
A descending triangle breakdown saw losses of 20% from the bottom trendline as Ethereum Classic moved towards the $78-support. Post the fall, buyers did enforce a recovery above $101.3, but sideways movement was seen over the past few sessions.
The ADX dropped from a peak of 35 to 20 and pointed to a weakening trend. The RSI was trading in neutral territory around 50. ETC’s technicals, coupled with muted trading volumes, indicated consolidation moving forward. This could likely take place between $116.8 and $78.1. A breakout in either direction would likely see sharp movements in the ETC market.