Polkadot, MATIC, Solana Price Analysis: 29 May

Polkadot was trading within a rising wedge and stared at the barrel of an 11% retracement on the charts. MATIC slipped below its EMA Ribbons as a pullback phase was in order. Finally, Solana could see a bounceback from $26.07-$19.2, but gains would likely be restricted.
Polkadot [DOT]
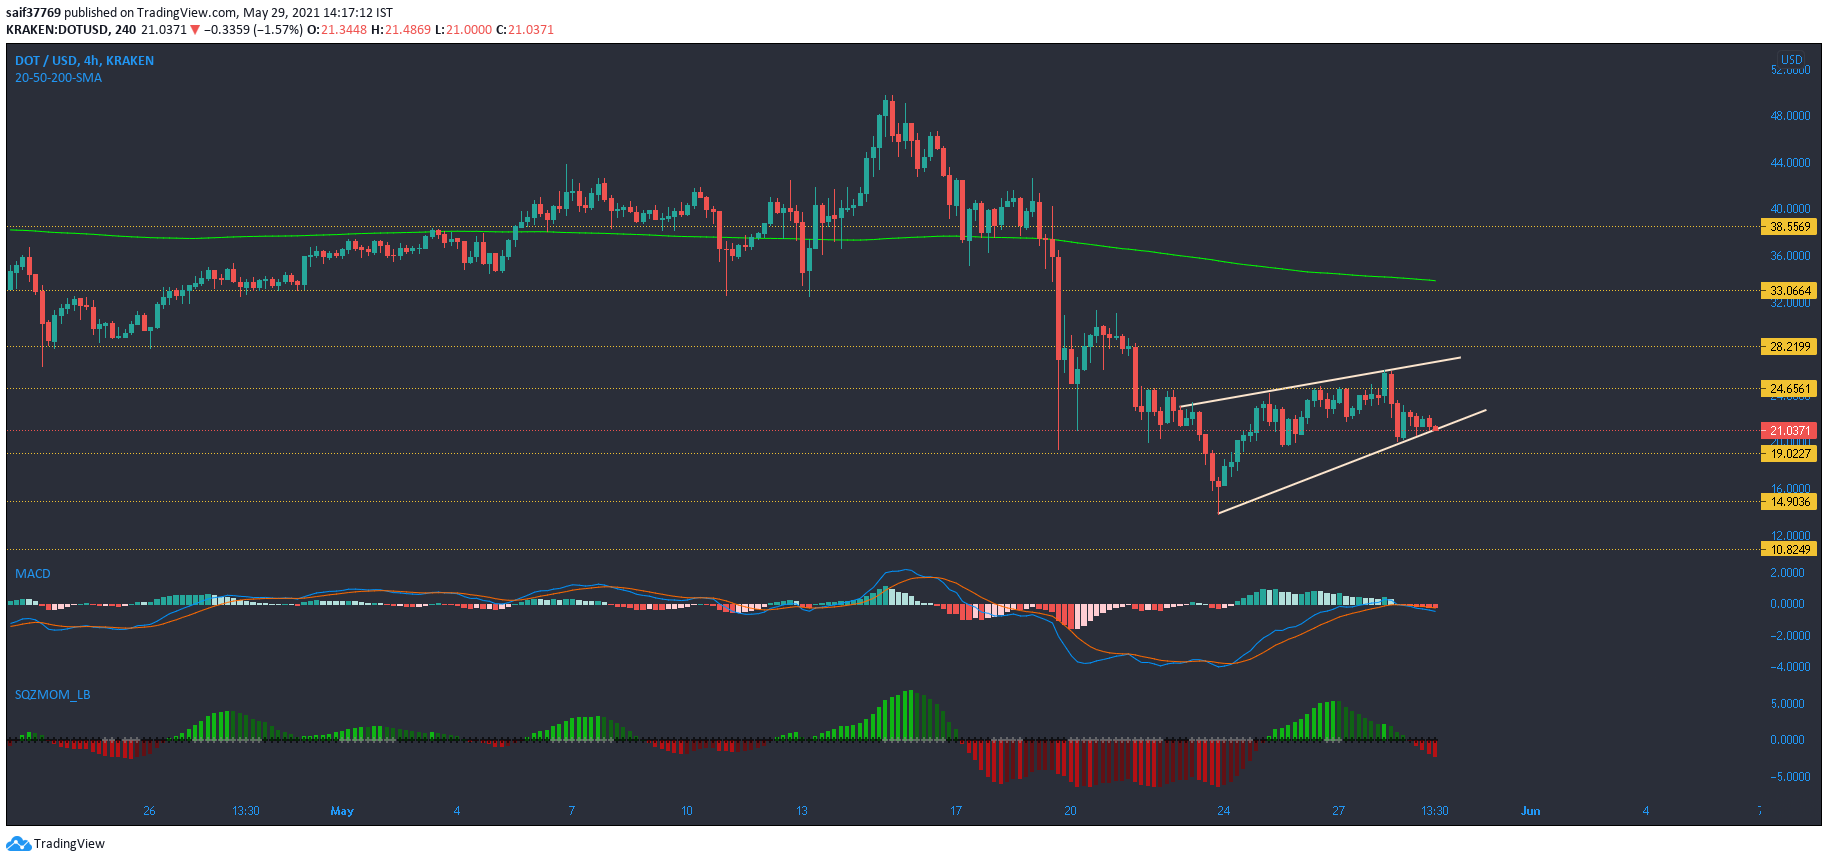
At the time of writing, the world’s ninth-largest cryptocurrency, Polkadot, was trading at $21.23. Down by 8% over the last 24 hours, the cryptocurrency was heading towards the bottom trendline of its rising wedge pattern. The pattern also presented a few outcomes for DOT moving forward.
A break below the lower trendline could result in a 11% retracement towards $19.7. Steeper losses would likely be countered at another defensive line at $14.9. Conversely, a breakout above the $28.2-resistance could culminate into a 18% hike around $33-34. Back and forth movement within the pattern would make the channel stronger and accentuate the chances of a breakout in either direction.
According to the Squeeze Momentum Indicator, market momentum lay on the bearish side. Watch out for a series of white dots as increased volatility would result in a sharper price swing. The MACD’s bearish crossover agreed with SMI’s stance.
MATIC
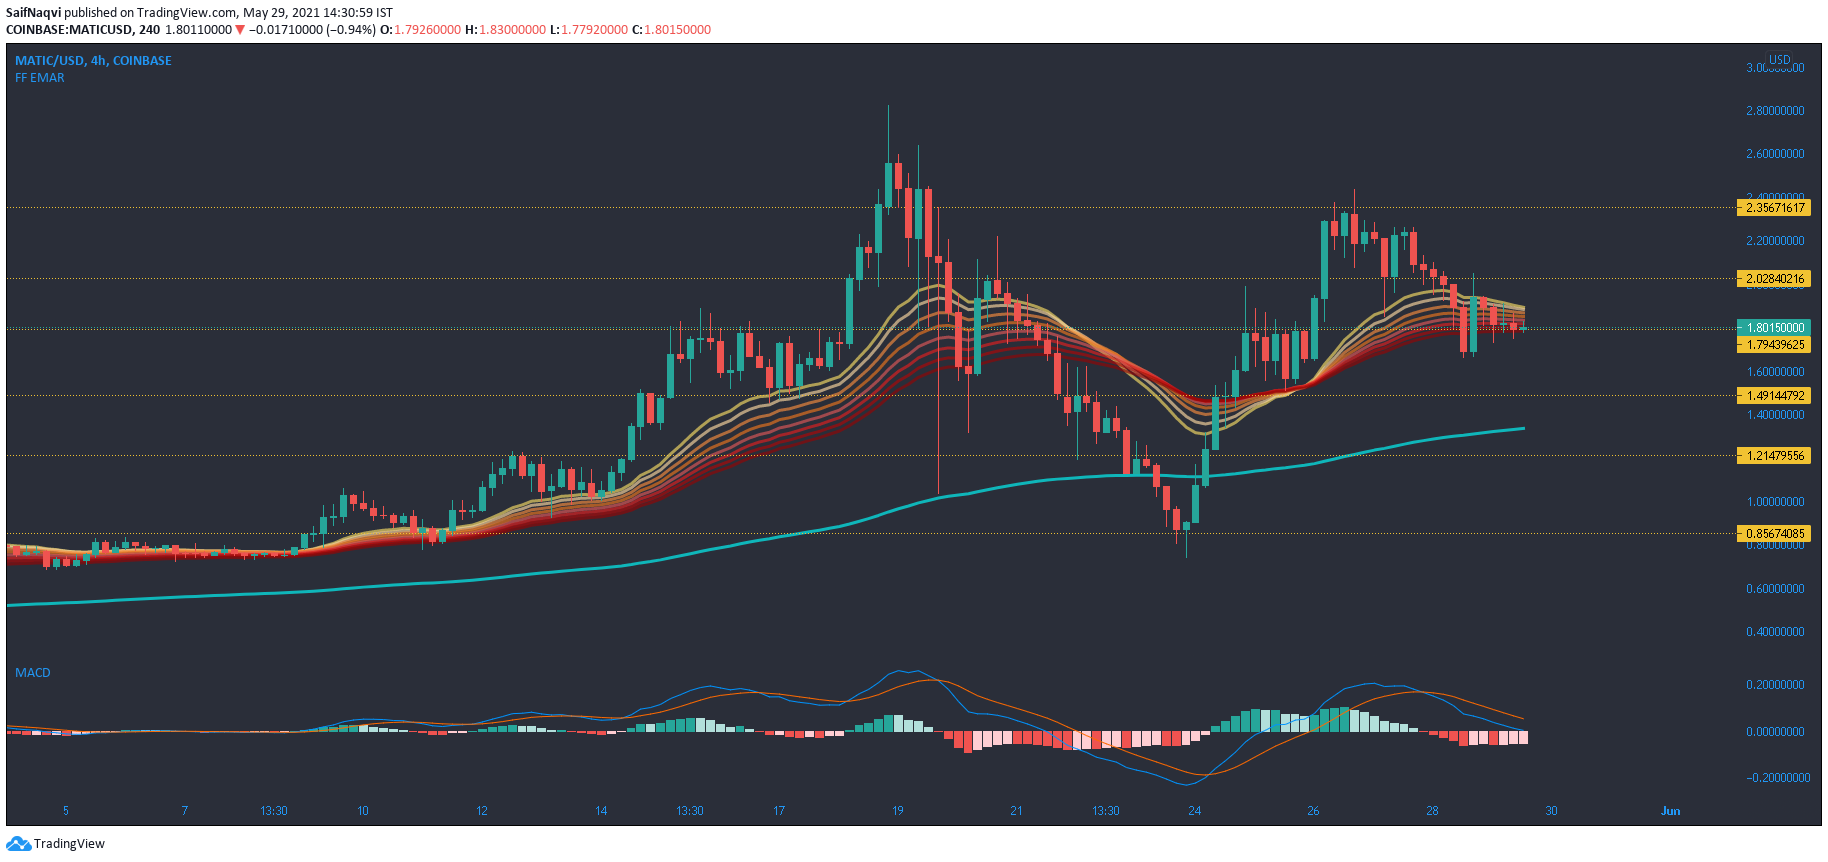
The constricted nature of MATIC’s EMA Ribbons suggested a pullback phase for the crypto-asset. On the 4-hour chart, candlesticks moved below their EMAs and headed towards the defensive line at $1.49. A breakdown could see losses towards the 200-SMA (light blue) around $1.31-1.21. If MATIC flips bearish conditions and manages to post gains, sellers would likely return $2.35-$2.08. However, a break above this channel could allow for a fresher ATH.
MACD’s downtrend suggested that bulls were losing strength after a sustained rally over the past few days. A fall below equilibrium would likely result in more sell signals.
Solana [SOL]
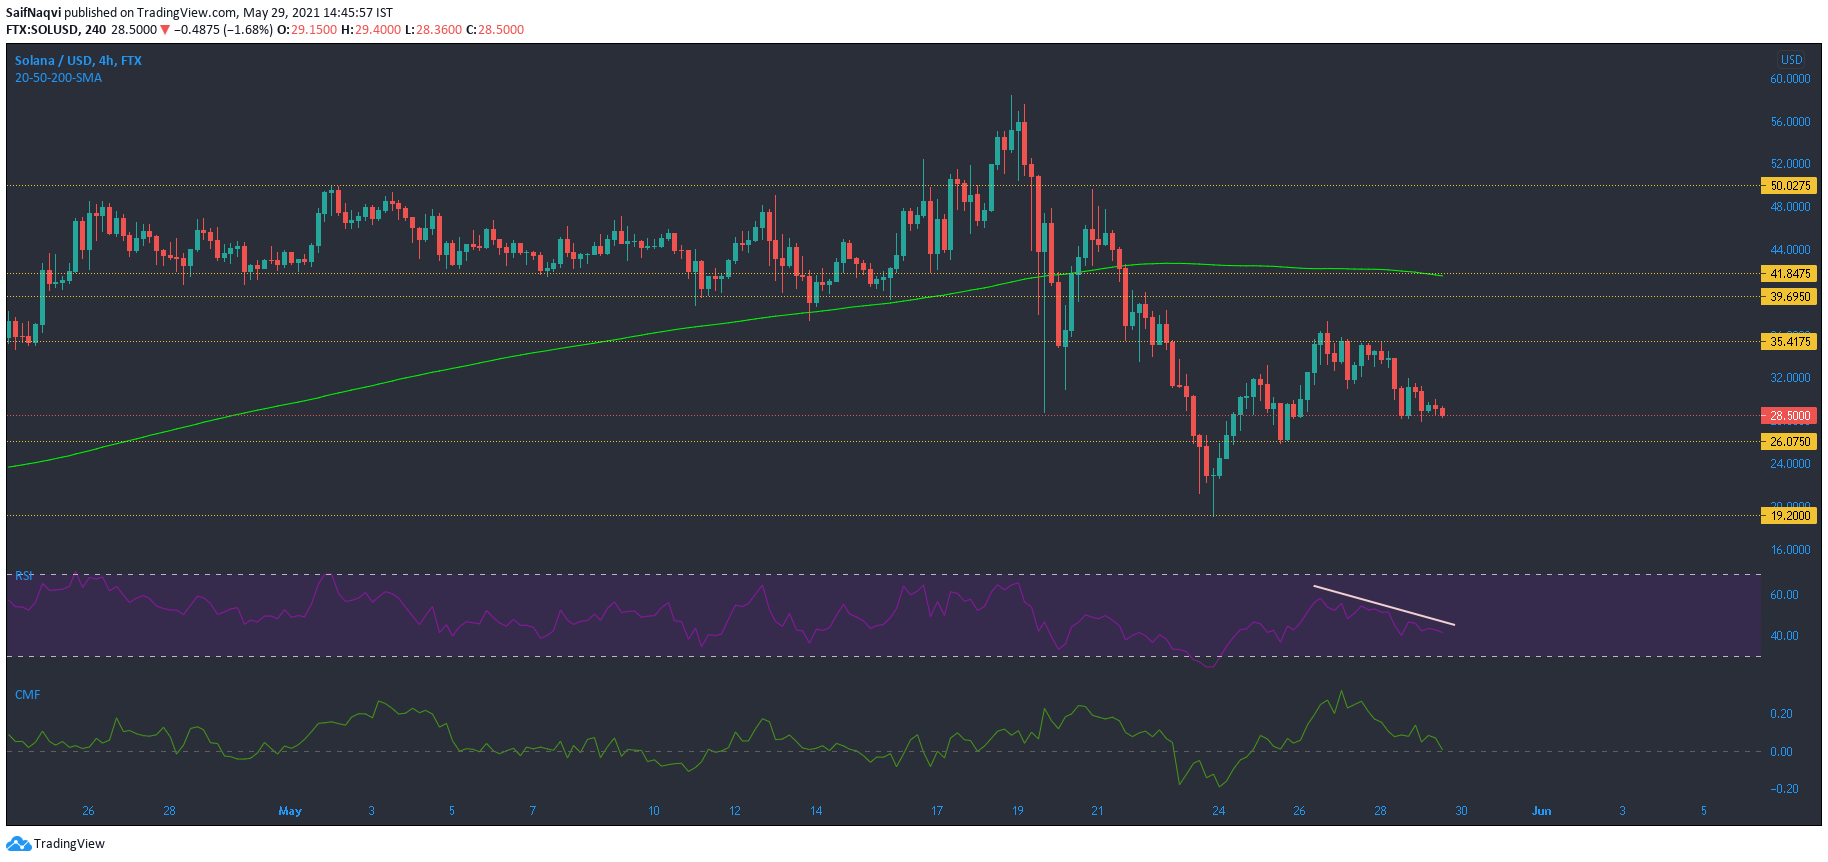
Although Solana saw southbound movement on its 4-hour chart, it moved back towards the demand zone of $26.07-$19.2. A fallback in this area would likely lead to a bullish reversal, but the focus would be on resistance marks moving forward. Considering a weak broader market, gains for SOL would be limited to the $35.4-resistance.
Another barrier lay between $39.7-41.8- bolstered by 200-SMA (green). Retaking these key areas could result in a comeback to early May highs, but stronger cues were required for such an outcome.
The RSI’s downtrend indicated a weakening trend, but a reversal can be expected from the oversold region. Meanwhile, the Chaikin Money Flow’s move below the half-line might suggest higher capital outflows than inflows.