Polkadot, Avalanche, Bitcoin Cash Price Analysis: 17 December

As the bears deny any bullish retrieval attempt, Polkadot dipped below its multi-month resistance level and poked its five-month low on 15 December. Further, Bitcoin Cash formed a reversal pattern as it continued its slump.
Avalanche displayed a solid recovery over the past few days but formed a reversal pattern too on its 4-hour chart.
Polkadot (DOT)
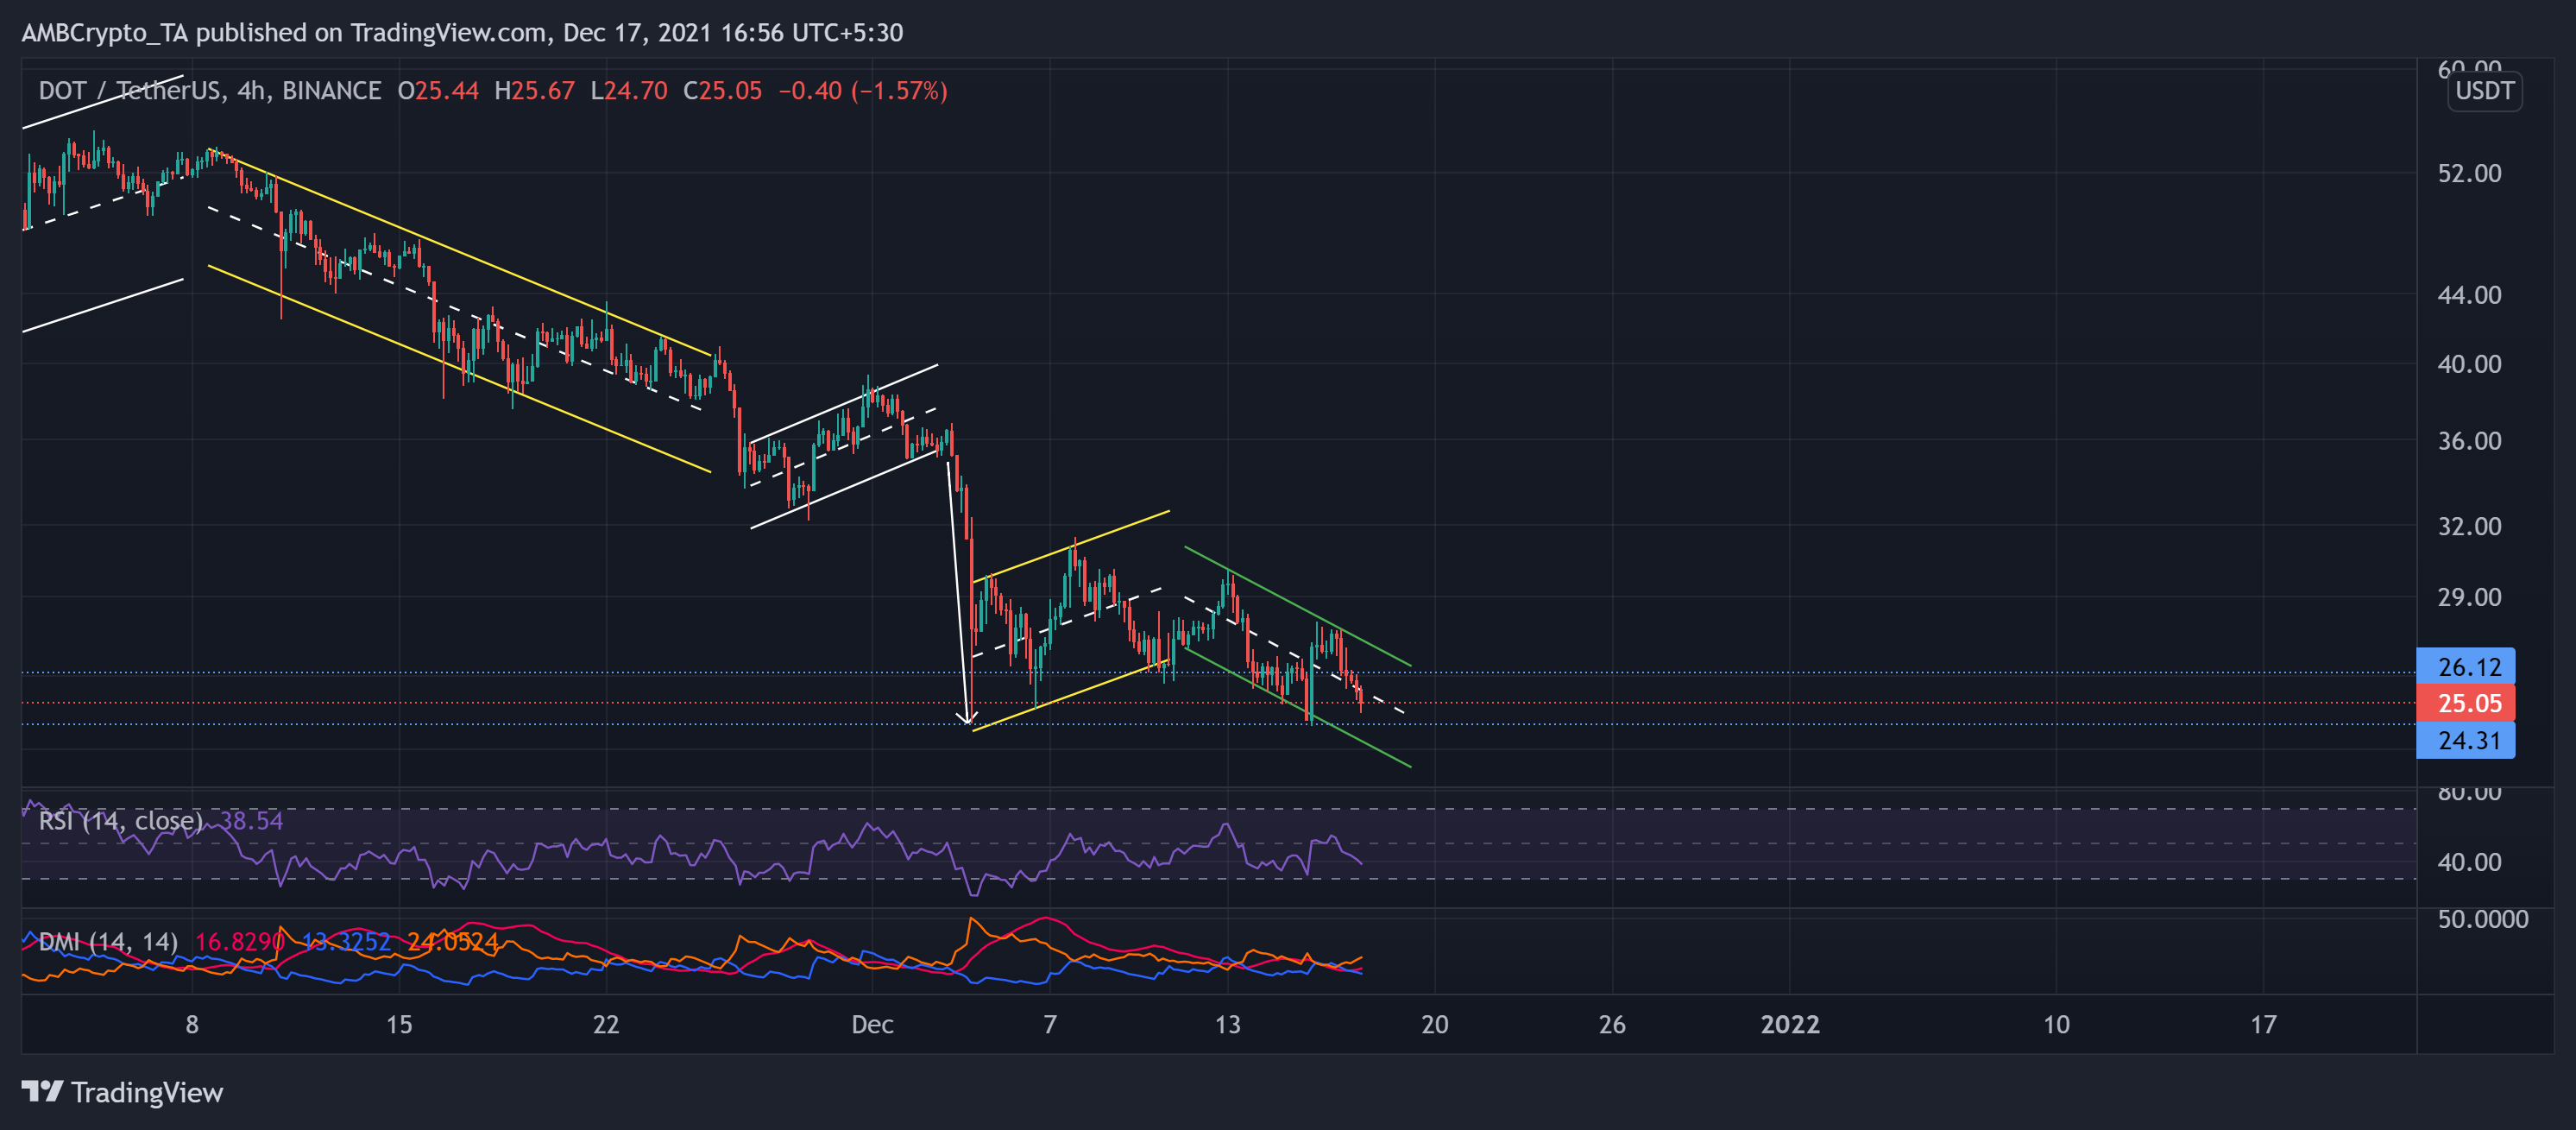
DOT witnessed a bearish flag breakout on 11 December and moved between the parallel lines heading south (green). This fall was the third major pullback since striking its ATH, which pushed the price below the 15-week resistance at the $26.12-mark.
Now, the immediate level for the bears to test existed at the $24.3 mark before any further trend commitments. The alt has aggressively declined after touching its ATH on 4 November. As a result, it gravitated to poke its five-month-low on 15 December.
At press time, the alt traded 54.5% below its ATH at $25.05. DOT’s RSI dipped below the 40-level, revealing a powerful bearish influence. Further, the DMI affirmed the previous narrative by choosing the sellers. However, the ADX displayed a weak directional trend for the token.
Avalanche (AVAX)
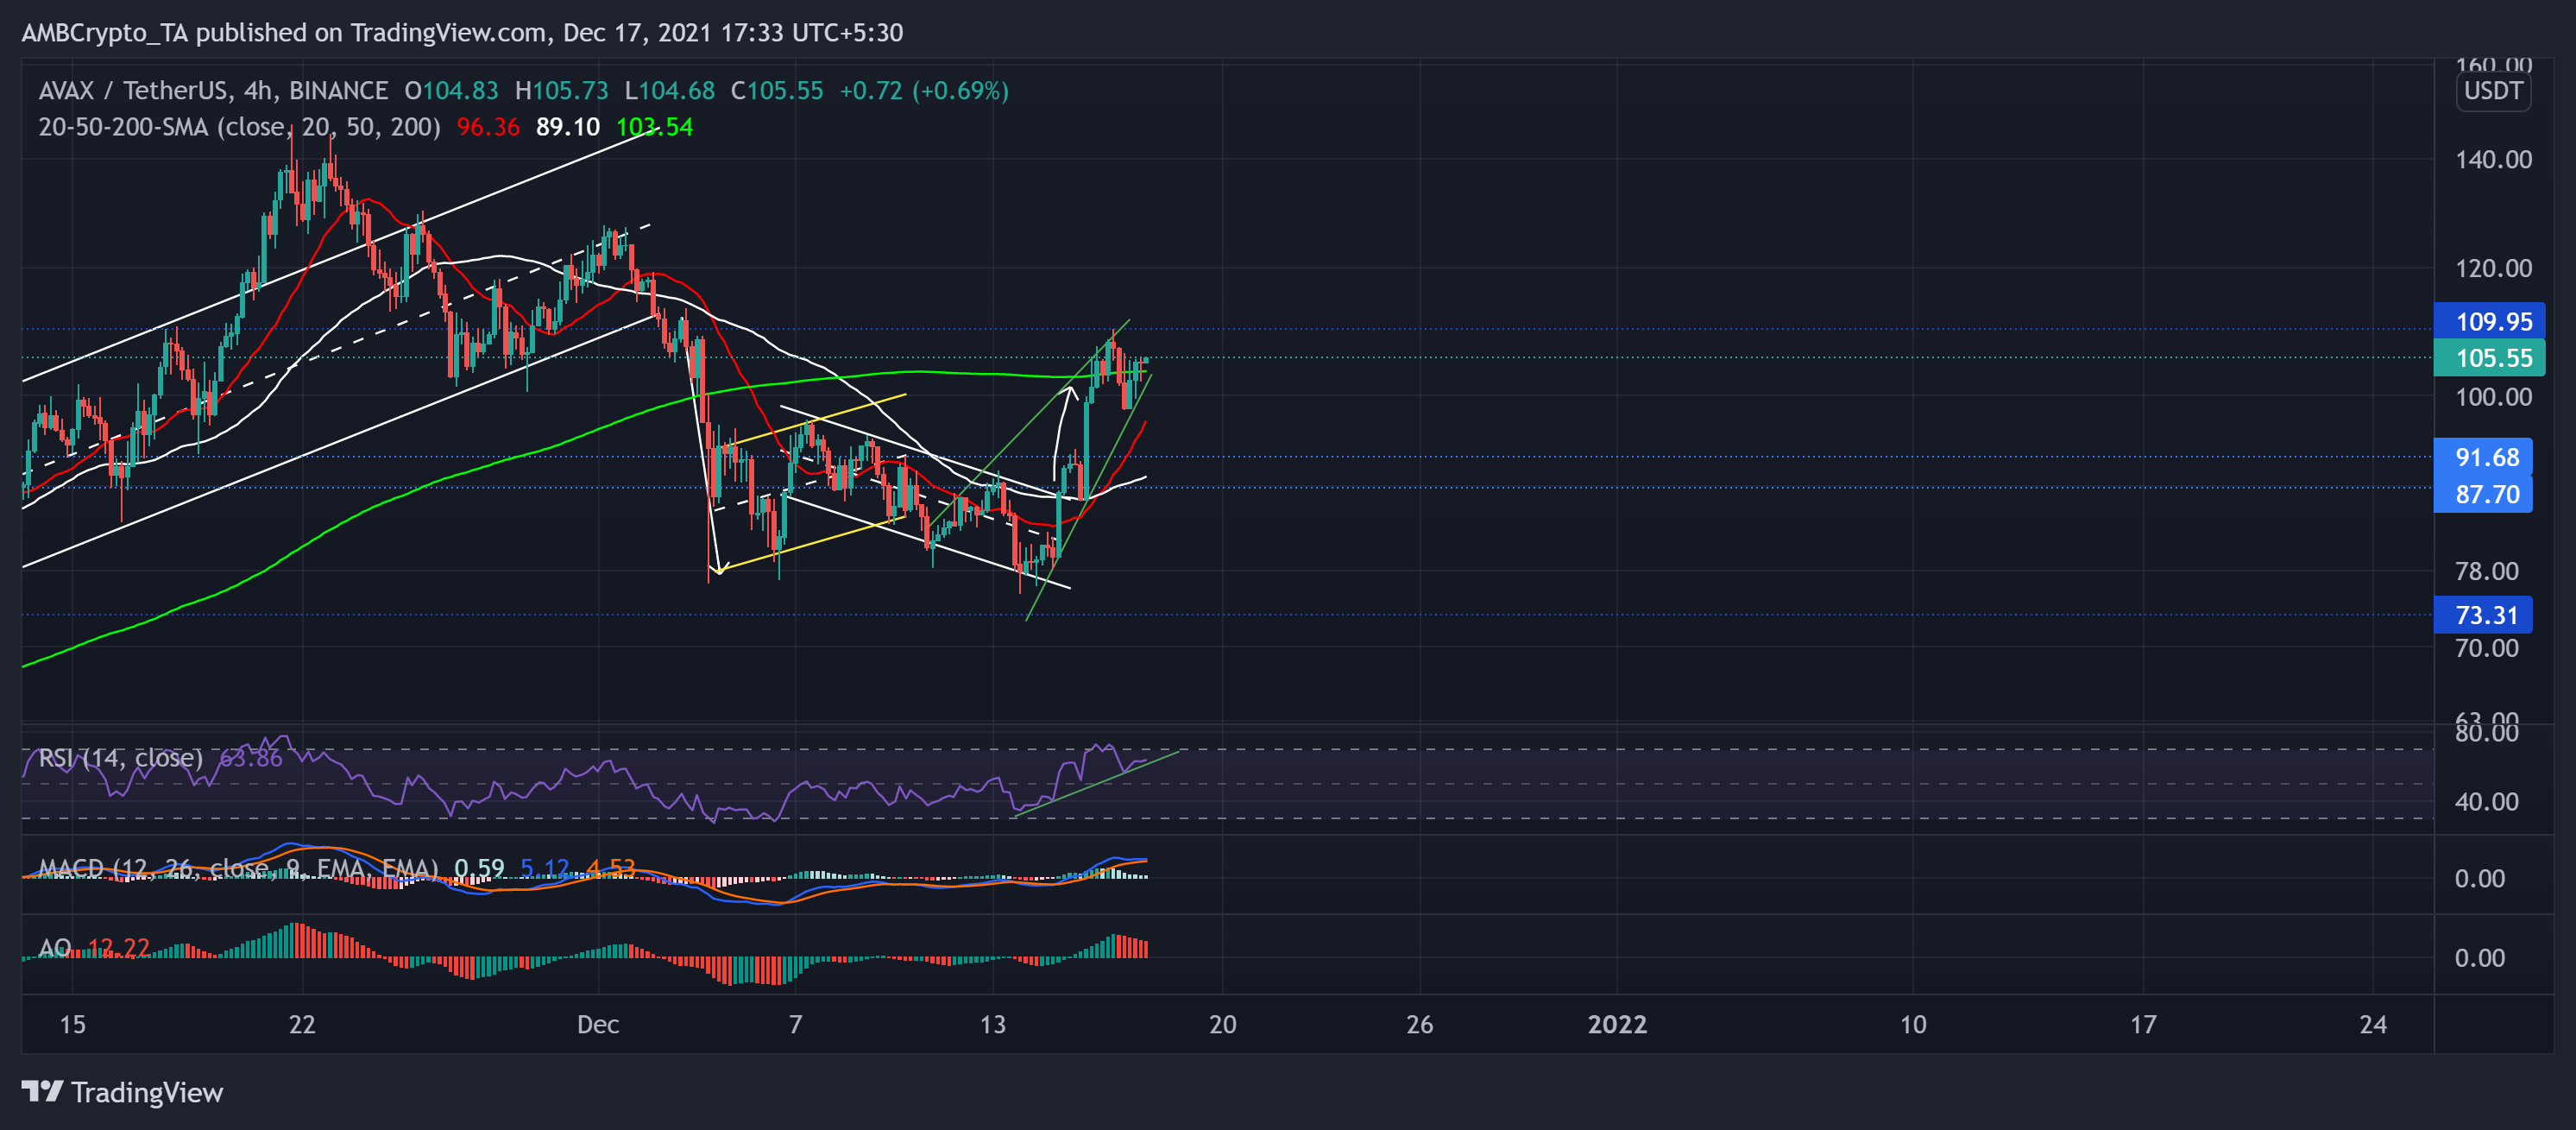
After invalidating its long-term bullish trendline (since July), AVAX seemed to extend its declining behavior after forming a bearish flag during early December. This decline pushed the price below the $87.7 mark as the price poked its five-week low on 13 December.
The alt saw a down-channel (white) breakout after an over 37.5% jump from $78 on 14 December until it poked $110 (two-week high) on 16 December. While the recent developments on its blockchain propelled this jump, it formed a rising wedge (reversal pattern) on its 4-hour chart.
At press time, AVAX traded above its 20-50-200 SMA at $105.55. The RSI retested the overbought region twice and plunged towards the 62-level. Also, the MACD chose the bulls but hinted at their decreasing power. Considering the reversal pattern and the momentum indicators, AVAX could see a near-term setback.
Bitcoin Cash (BCH)

After an impressive October run, the alt marked lower lows in a descending channel (yellow). As BCH saw a 13.7% down-channel breakout, it further took a downward turn and formed a bearish flag on its 4-hour chart. Thus, with the increased bearish force, the bulls failed to uphold the 21-week resistance at the $470.2-mark.
Over the past few days, the alt saw a descending broadening wedge (reversal pattern). It was down by over 4.17% in the past 24 hours.
At press time, BCH traded 88.6% below its ATH at $432.8. The RSI displayed weak signals and struggled to cross the half-line. Also, the DMI hinted at a slight bearish preference. But the ADX flashed a weak directional trend for the coin.


