Polkadot, MATIC, Uniswap Price Analysis: 06 June

While the market underwent a set of corrections, Polkadot, MATIC, Uniswap were in the news for different reasons. Polkadot’s recent $30 million funding from Master Ventures, Polygon ( MATIC ) becoming part of the Bitwise 10 Large Cap Crypto Index (BITX) this month and the deployment of Uniswap V3 on the Arbitrum mainnet were the highlights of the week.
Polkadot [ DOT ] :-

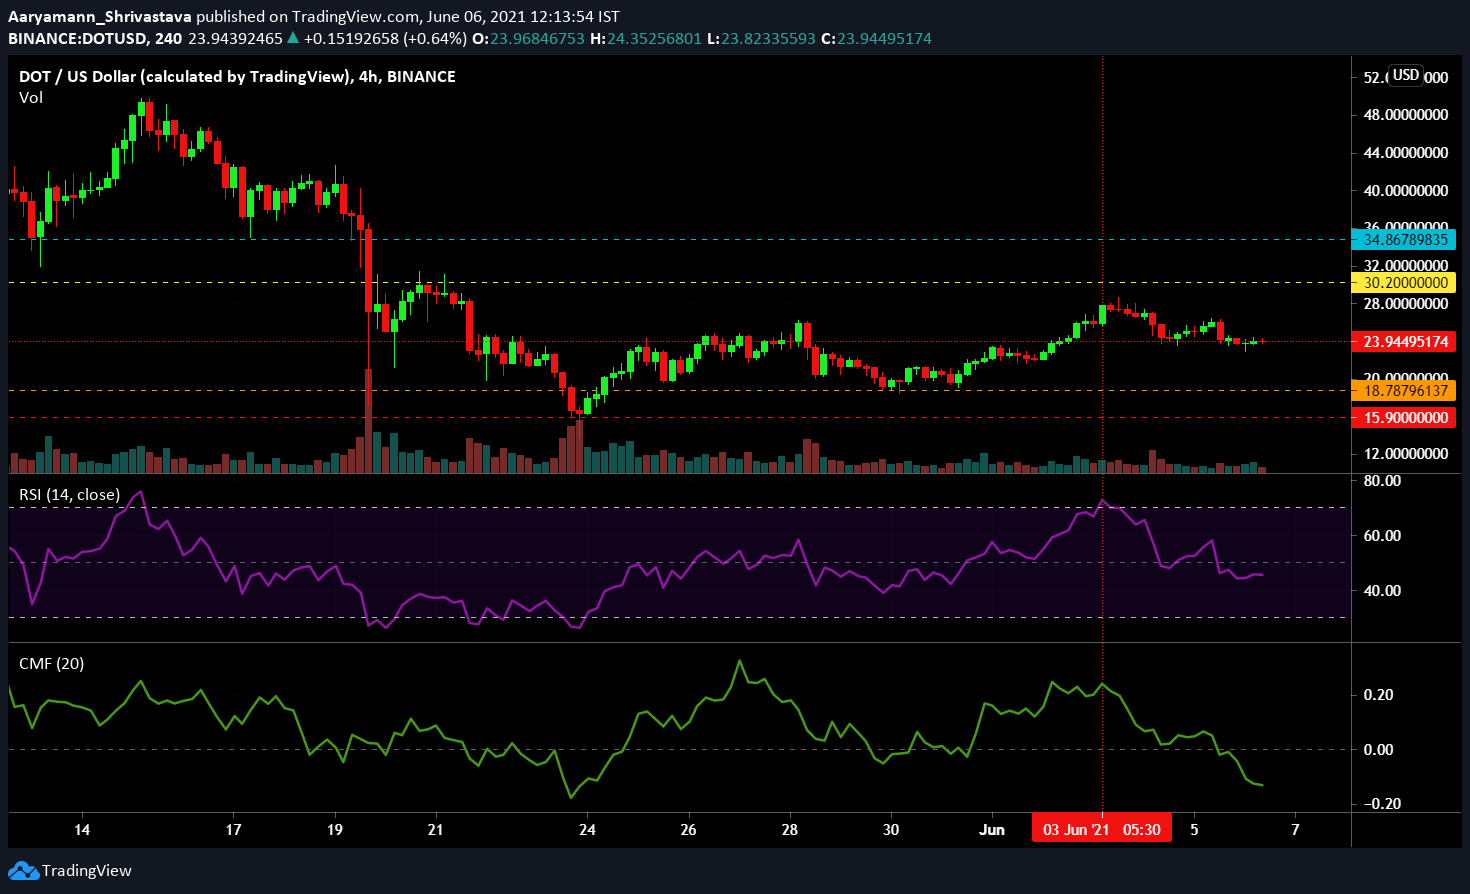
Source: DOT/USD – TradingView
DOT had a strong beginning this month. The coin climbed up by 26.39 % in 3 days and soon after fell down. June 3 witnessed high buying pressure as Relative Strength Index moved into the overbought zone and the indicator fell just as quickly as it peaked. Selling pressure came into effect and dropped the indicator below the neutral line, lingering at 46.35 at the time of writing.
Chaikin Money Flow displayed that capital outflows have been dominating inflows. This has kept the indicator well below the neutral mark.
The coin will remain within its $ 30.2 resistance and $18.7 support levels.
MATIC :-

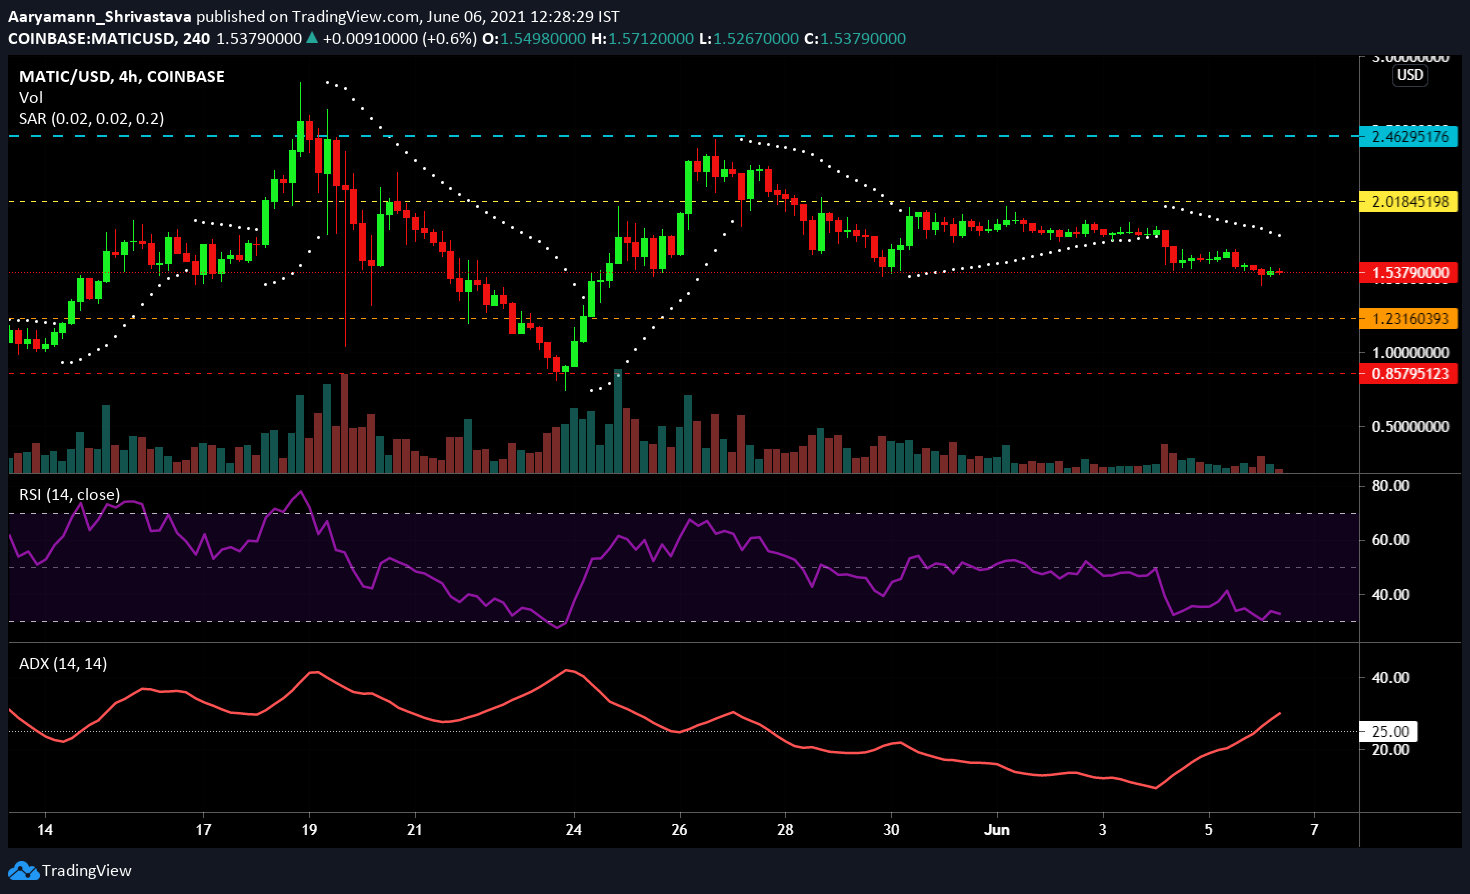
Source: MATIC/USD – TradingView
Even though MATIC has been creeping towards its May ATH, the coin fell back under the $2.01 resistance level. Since then, a sideways movement was present till June 4, further pushing the prices down.
The coin fell below the $1.58 support level and established a new one at $1.23. On the same day, Relative Strength Index (RSI) fell below its steady neutral position and the purple line has been dragging in the oversold region, even at press time.
Parabolic SAR showed clear signs of a downtrend as the white dotted lines remained above the candlesticks. This downtrend is backed by the rising indicator of Average Directional Index (ADX). Its highly directional movement, past the 25.0 mark suggested an incoming downtrend.
In that case, MATIC holders should observe the price carefully. As long as the coin stays above the support level, the price can bounce back. Any stronger negative cues could drop the support level to $0.85.
Uniswap [ UNI ] :-

Source: UNI/USD, TradingView
Uniswap declined by 10% in the last 48 hours thanks to the market dip of June 4. Trading at $25.86, it was still above the established $22.17 support level. While for most of the last 10 days UNI had remained above the neutral line on MACD indicator, post the dip the indicator dropped again. At the time of writing, the indicator displayed a continuous bearish crossover with both, the blue MACD indicator as well as the red signal line, remaining below the 0.00 mark.
On Squeeze Momentum Indicator, bearish pressure continued to rise with the appearance of the light red bar at press time. The indicator maintained a squeeze for now with the black dots still visible.
Simple Moving Averages’ 100 SMA (red) line was under the price indicator. Even though the 50 SMA (orange) line remained above the candlesticks, broader market cues suggest a possible uptrend.
Even though the probability remains low, should the coin breach its resistance level of $29.93, the next one will be set at $32.63.


