Polkadot Price Analysis: 06 March

Disclaimer: The findings of the following analysis are the sole opinions of the writer and should not be taken as investment advice
Polkadot’s market has grown significantly over the past few months, both in terms of value and fundamentals. In fact, DOT’s growth can be evidenced by the fact that Open Interest in Polkadot’s Futures market has been surging lately. At the time of writing, DOT was trading at $33.24, with the altcoin having a market capitalization of $30.62 billion.
Polkadot [DOT] 6-hour chart
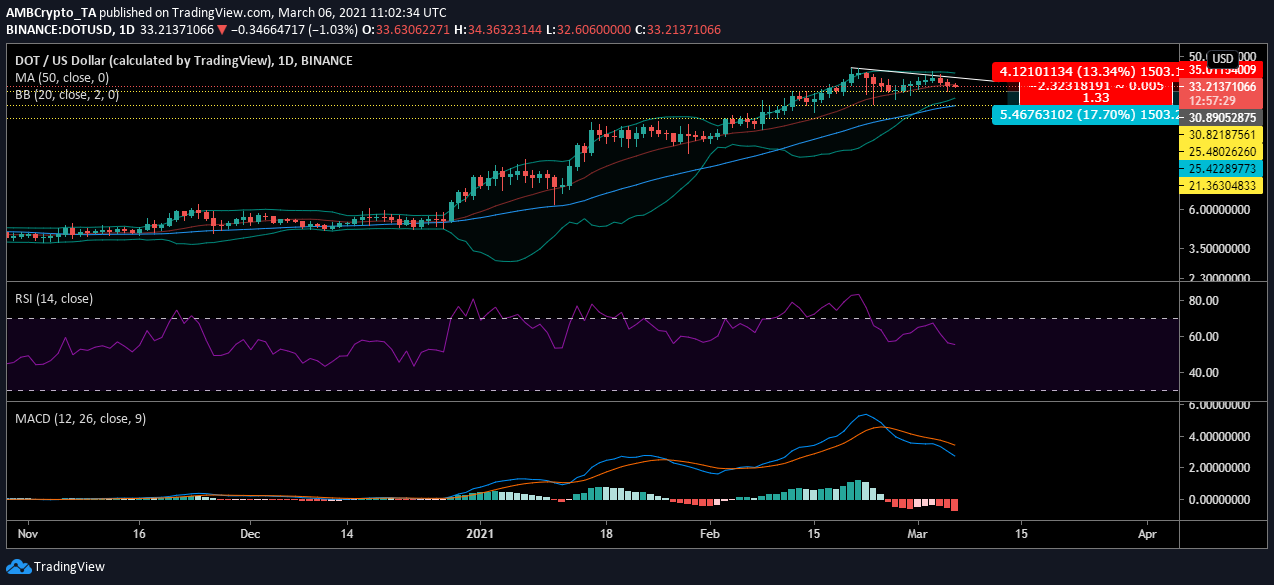
Polkadot’s six-hour chart [DOT] highlighted that of late, its value was shrinking within a descending triangle. DOT’s falling price was supported at $30.82, but the market trends suggested that a further drop in value could be imminent.
Such an observation would make Polkadot a strong bet for short-traders.
Reasoning
The Bollinger Bands suggested that there was barely any volatility in the DOT market as the bands converged. However, the falling price could have contributed to the bands converging. Meanwhile, the Signal line was moving above the candlesticks as the sellers continued to sell.
With the altcoin’s price testing the support, the bearish trend might lead to a drop in the price of the digital asset. Further, the MACD indicator was highlighting strong bearishness in the market, with the MACD crossing under the Signal line. Ergo, the prevailing market trends seemed to be siding with the sellers, something that could result in a sell-off in the near-term.
While the Relative Strength Index bounced from the overbought zone, it was observed to be approaching equilibrium, at press time. However, this seemed to suggest that buyers were trying to level the market.
Crucial levels to look out for
Entry-level: $30.89
Stop-level: $35.01
Take profit: $25.42
Risk to Reward: 1.33
Conclusion
Polkadot’s six-hour chart highlighted a bearish trend extending across the market. This bearish trend may result in the value of the digital asset dropping to $30. However, in the meantime, the altcoin’s price may continue to oscillate within the descending triangle and around its support level.


![Rising bond yields put Bitcoin [BTC] at risk — a Fed rate hike could be next](https://ambcrypto.com/wp-content/uploads/2026/08/IMG_4752-e1785656382502.webp)