Polkadot Price Analysis: 13 March

Over the past week, the $38.26 level has offered strong resistance to the price of Polkadot. A daily session has not closed above this level since February when $42 was touched before selling pressure drove prices as low as $26.5. In the short-term, DOT is trading in an important region, just below a channel pattern. The $36.6 is expected to offer resistance, but demand could drive the prices past this level.
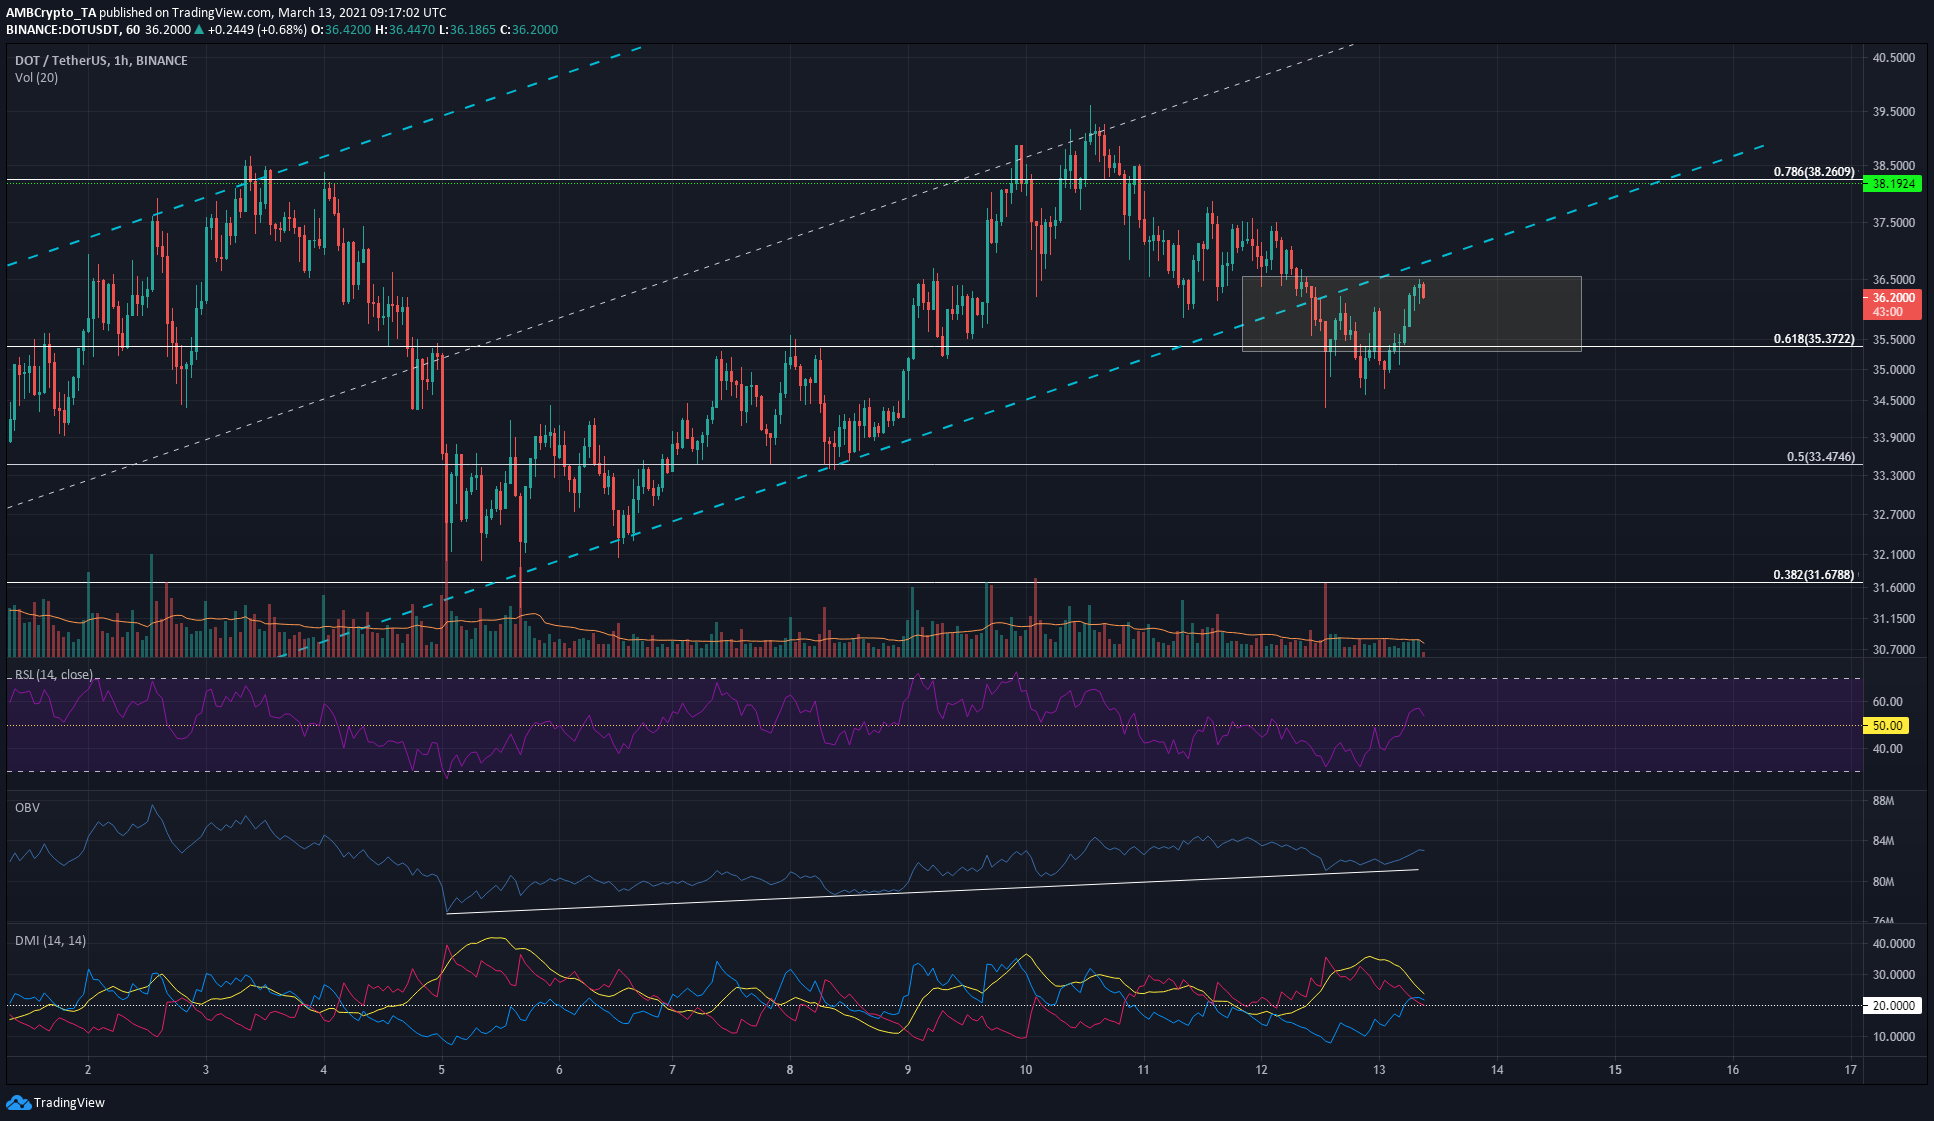
Polkadot 1-hour chart
On the 4-hour charts, an ascending channel pattern (cyan) was seen. DOT has been trading within this channel for most of the past three weeks. The lower boundary of the channel has served as strong support, but the $38.2 horizontal level was stubborn resistance.
As seen on this chart, the two times the price tested this level as resistance was also when $38.2 had confluence with the upper channel boundary and the mid-point of the channel. This confluence added strength to the horizontal resistance level.
Subsequently, DOT slipped beneath the channel to find support at the $35.37 level of support (plotted using Fibonacci retracement tool for DOT’s drop from $42.28 to $26.5). And this highlighted region is where the market’s next direction will be decided. The defense of the $35 region over the past 48 hours gives some bullish expectations for DOT.
Reasoning
The reason for expecting DOT to climb back into the channel is demand from buyers. As the OBV showed, there has been steady demand behind DOT since its dip to $31.6. The OBV has been trending higher and the defense of the $35 region on the back of steady demand could see DOT recover toward $38 and possibly higher.
The RSI also climbed past neutral 50 to show that bullish momentum was picking up on the shorter timeframes.
The Directional Movement Index showed a strong bearish trend was in play, but the past few hours have seen the ADX and the -DI (yellow and pink) drop, denoting the strength of the move was declining.
Conclusion
DOT rising past $37.5 would be a sign of bullish strength. A move above, and retest of, the $38.2 level to flip it from resistance to support can be used to enter a long position. A retest of the $35 region after the bounce to $36.4 in the recent hours could spell trouble for bulls.


