Polkadot Price Analysis: 14 December

Disclaimer: The findings of the following article are the sole opinions of the writer and should not be taken as investment advice
In the past, Polkadot’s price registered a crash due to its correlation with the larger altcoin market. However, at the time of writing, the situation seemed to be bullish for DOT, a project that is one of the main competitors to Ethereum, especially in the DeFi space. While ETH has scalability issues, newer competitors like DOT have the edge necessary to overtake ETH.
However, since ETH has the first-mover advantage, the same has prevented its collapse on the charts.
Polkadot 4-hour chart
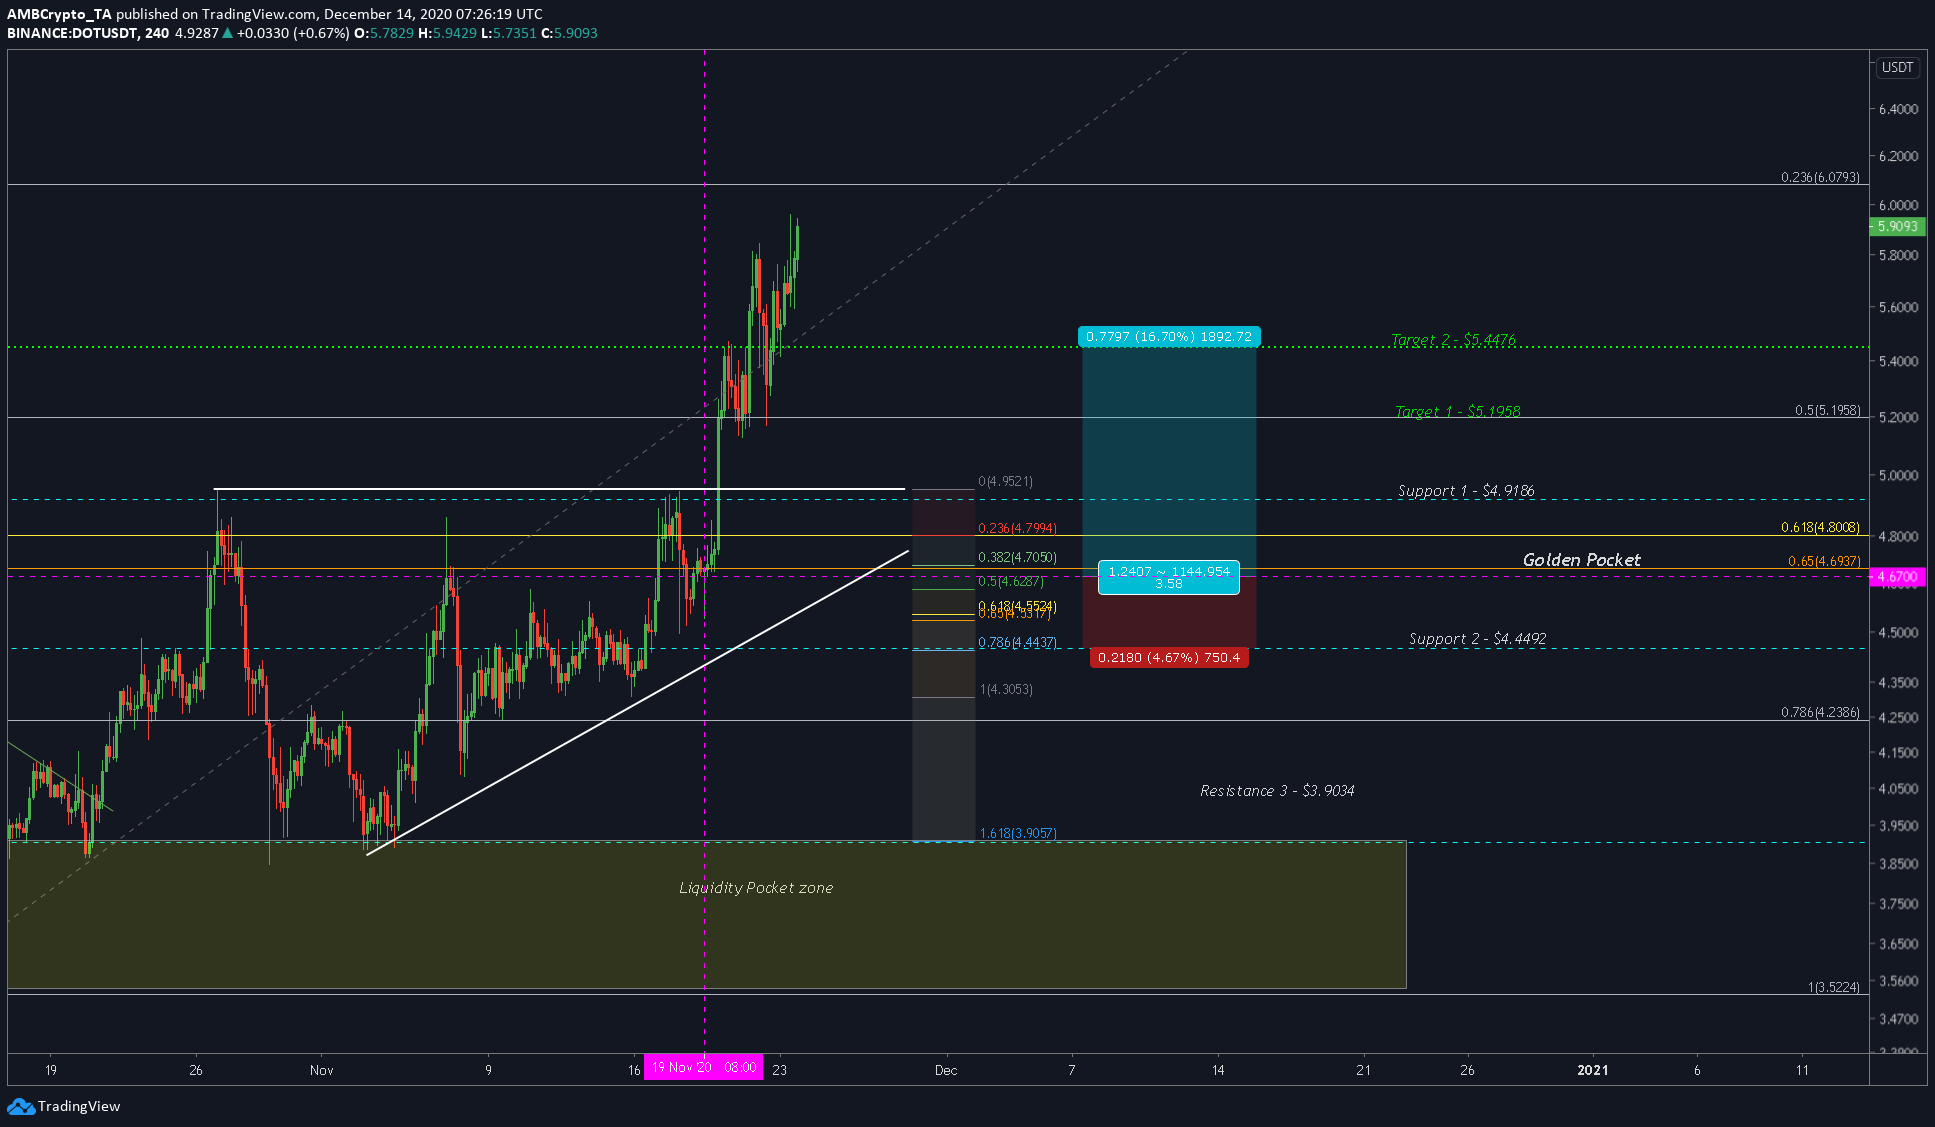
The chart attached above underlined the predictions made in an article dated 19 November. Since then, Polkadot has not just hit its targets, but it has crossed beyond them yielding profits of ~30%.
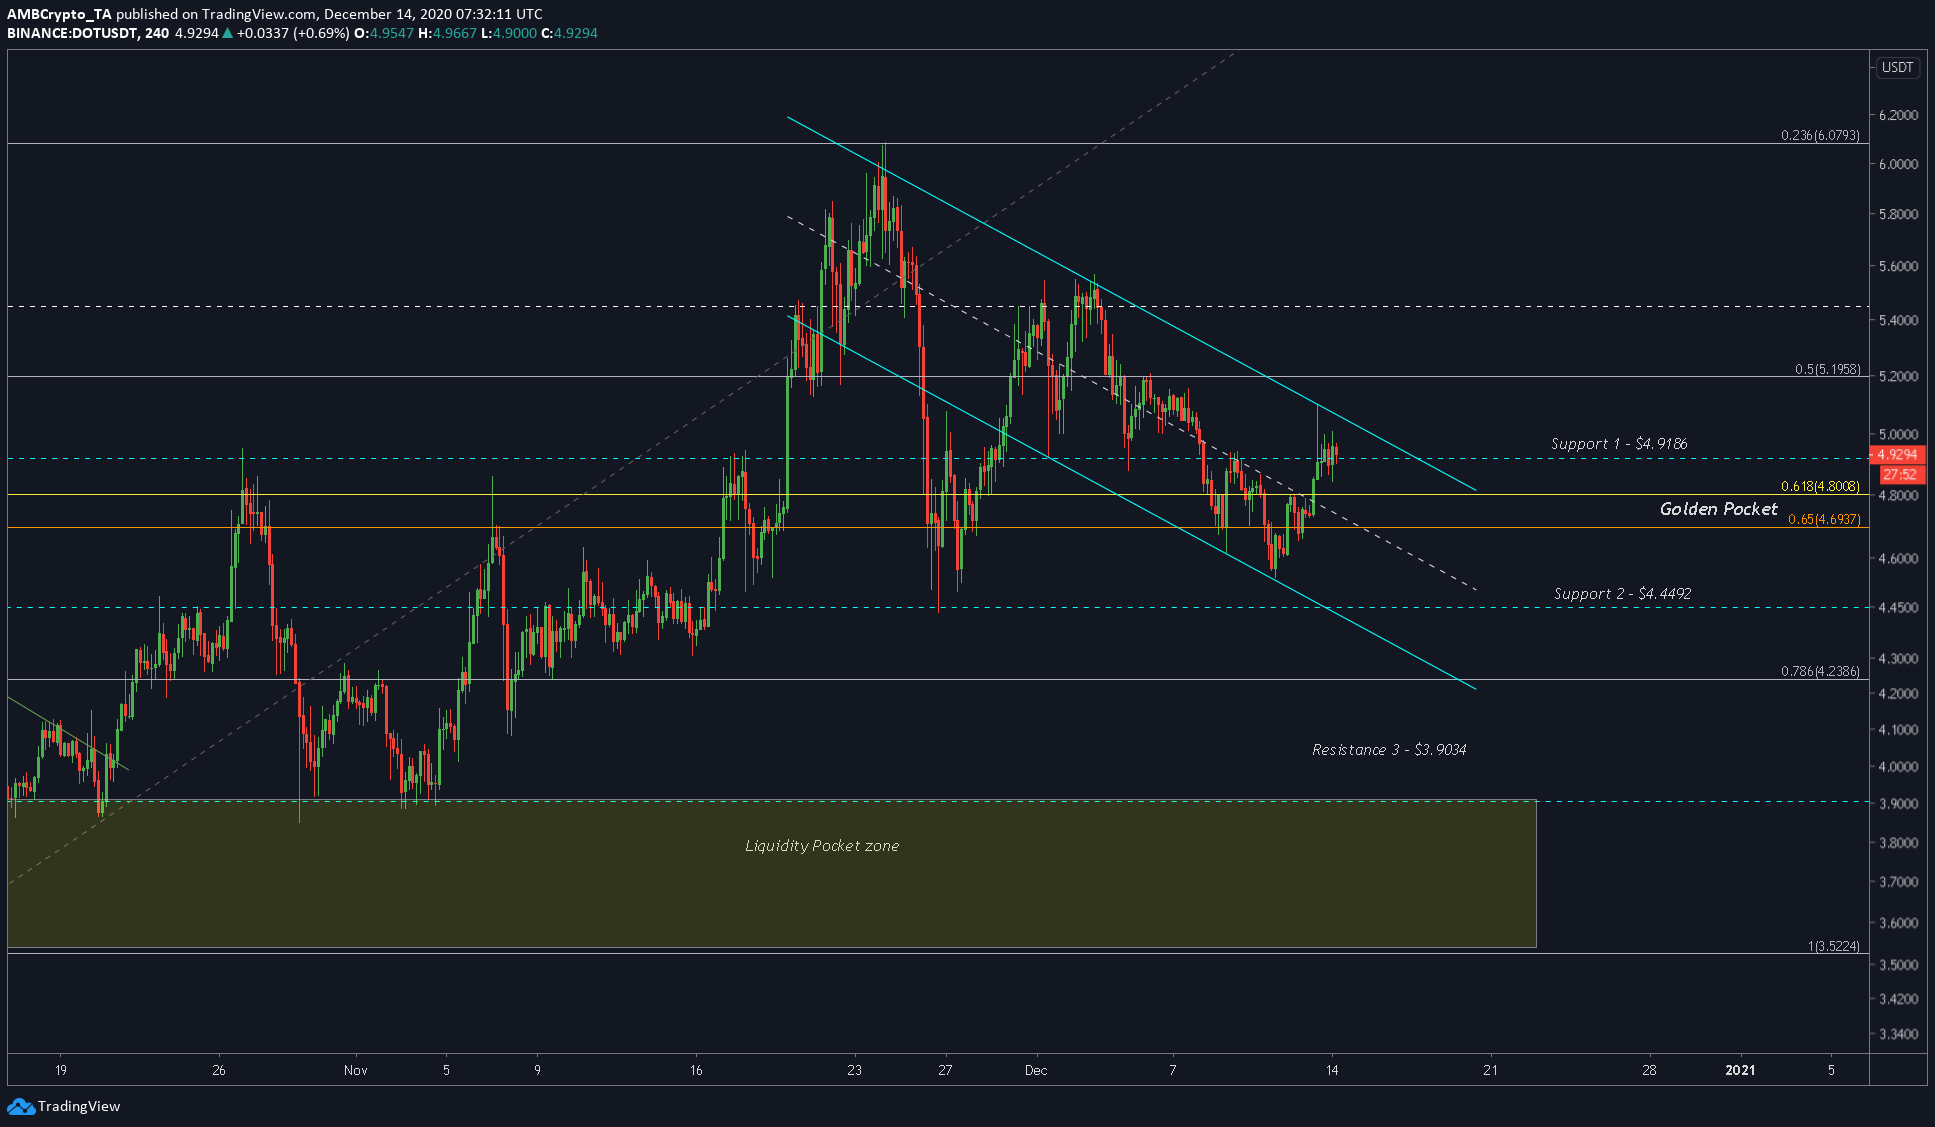
The cryptocurrency’s price blasted through the golden pocket and hit its target. However, a lot has happened since hitting those highs. The price retraced almost all of its profits and, before climbing up again. This can be seen in the chart attached below, a chart that also highlighted the formation of a bullish pattern.
Rationale
As mentioned previously, the bullish pattern was the descending channel, a pattern that seemed to be close to the breaking point. The golden pocket extending from $4.69 to $4.80 will be the bouncing pad that will cause the breakout.
However, there are scenarios that can prevent this from happening. These include,
- Bitcoin crashes, pullings alts down with it.
- The golden pocket fails due to selling pressure, creating a similar scenario witnessed at the start of the channel
Hence, it is advised to take extra precautions before entering the trade at the golden pocket. The RSI indicator showed that it was heading towards the overbought zone, however, there seemed to be enough space for the price to push towards the upper end of the channel.
Should the pocket fail, the support at $4.449 will act as a line of defense.
Conclusion
DOT, at the time of writing, was testing the support at $4.918. It is expected to break the bullish pattern and surge higher. However, this isn’t an asymmetric bet since the downside also seems possible. The golden pocket will decide if taking a long position will be possible or not.


