Polkadot Price Analysis: 26 January

Disclaimer: The findings of the following analysis are the sole opinions of the writer and should not be taken as investment advice
Polkadot has been one of the market’s top performers in 2021, with the cryptocurrency’s price action speaking for itself. In fact, since 28 December, the crypto-asset has risen by a whopping 300%, a figure that highlights its tremendous rise on the charts.
After avoiding corrections for a week, the asset seemed ready for a period of drawdowns. However, the crypto’s market structure was flashing ambivalent signals at press time, with DOT registering a market cap of $14.97 billion while ranked 4th on CoinMarketCap’s charts.
Polkadot 4-hour chart
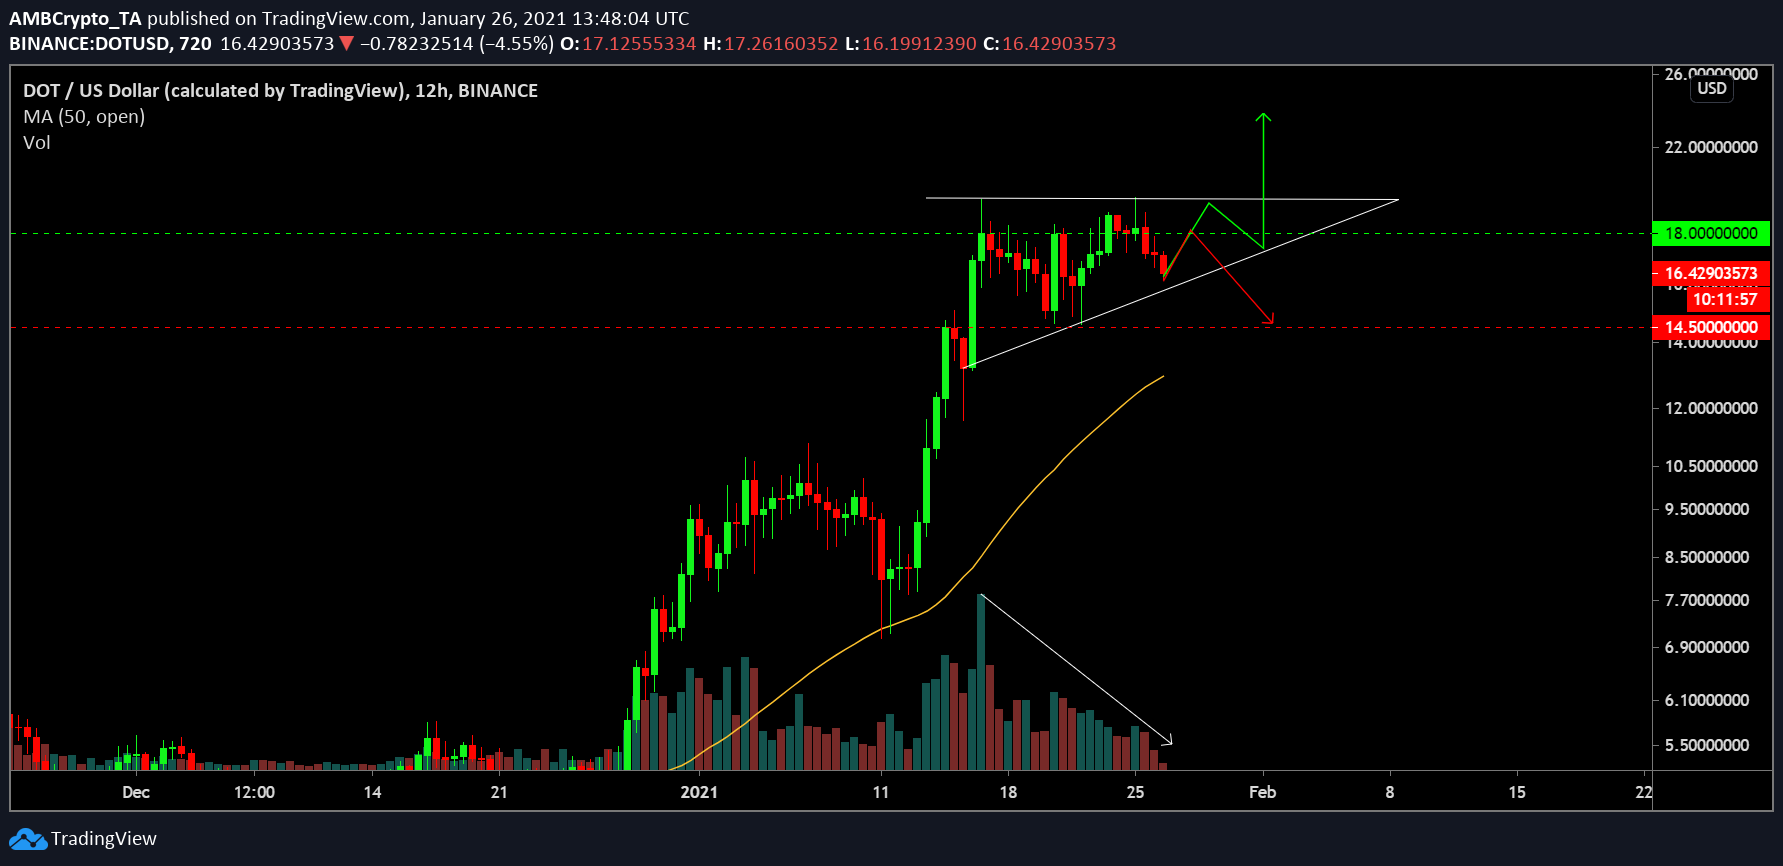
In the 24 hours before press time, Polkadot suffered a slump on the charts, with the asset dropping down to $16.42. However, the long-term chart highlighted the presence of an ascending triangle, one which predominantly kept bullish expectations alive. Further, the Market Structure dictated that the possibility of the price moving in the direction of the green line was true. It should be noted though that there have been cases of fakeouts in the past.
If Polkadot’s period of correction takes place over the next couple of weeks, the possibility of the asset consolidating down to $14.50 is widely probable. One of the major reasons for the same would be market exhaustion and the current bearish divergence forming with respect to DOT’s rise over the last 2 weeks.
Market Rationale

According to the Stochastic RSI, the crypto-asset may register an immediate pullback. However, historical movements suggest that DOT has the tendency to remain near the oversold region, whenever the price has dragged down the indicator.
The Relative Strength Index or RSI was exhibiting the rise of selling pressure as the indicator was starting to drop on the charts.
Finally, the Awesome Oscillator or AO was pointing to an immediate trend reversal, with the bears rising in momentum.
Conclusion
The correction period has been inevitable for Polkadot since the start of 2021 and it may manifest in the charts over the next few weeks. The immediate support at $14.50 should act as a bouncing board, before estimating a new bottom or top.


