Polkadot price prediction: DOT due for a pullback, but $24 by 2025 still on track
The buying volume has been soaring over the past month, evidenced by the OBV's new high.

- The DOT bearish divergence could see a price dip soon.
- The long-term Polkadot price prediction is bullish, with $24 as a target for Q1 2025
Polkadot [DOT] was on a strong bullish run over the past month. It reached a local high at $11.65 on the 4th of December but the bulls have not managed to flip the $10.5 zone to support yet.
The Polkadot long-term price prediction is firmly bullish, but the market needs time to consolidate and recuperate.
Polkadot price prediction bearish in the short term
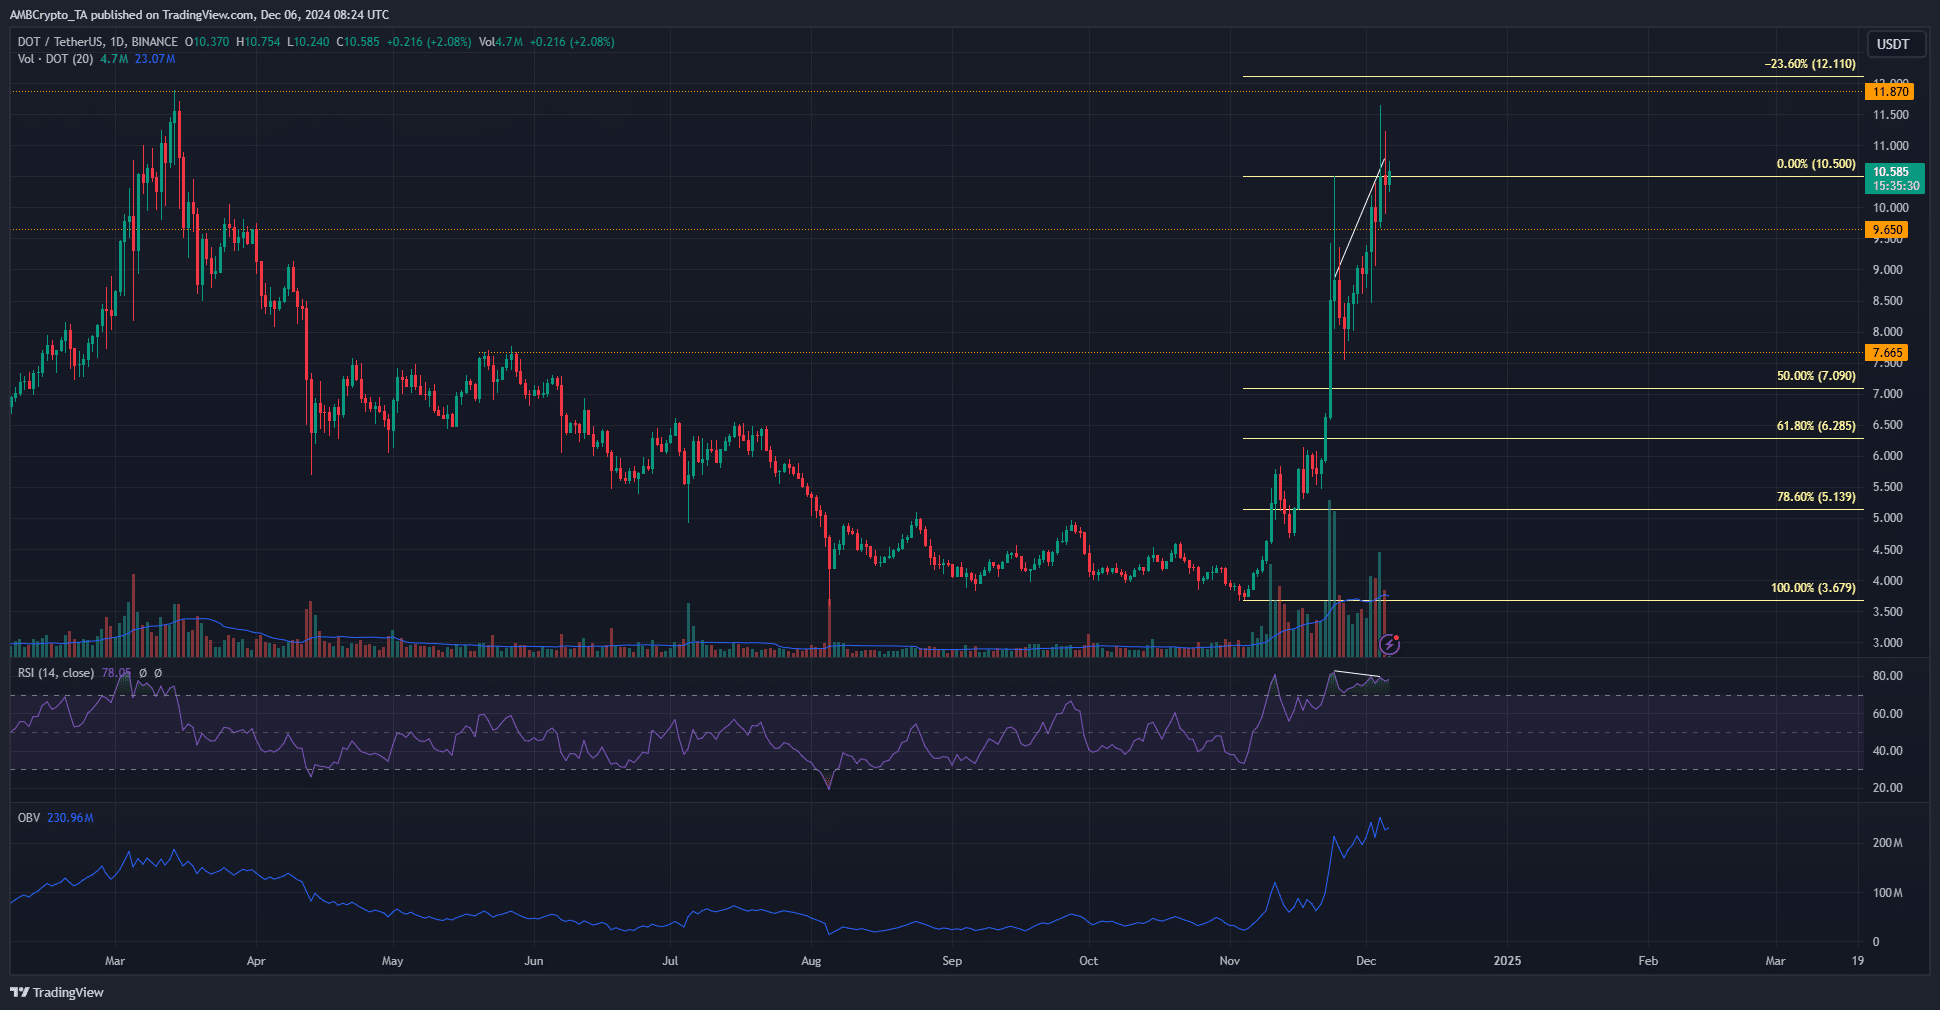
In the 1-day timeframe, Polkadot continued to exhibit a strong bullish tendency. The buying volume has been soaring over the past month, evidenced by the OBV’s new high. This high was well above the one formed in March when DOT was trading at $11.8.
While this sustained demand is an encouraging sight, the bearish divergence on the RSI was not. The RSI made lower highs in the past two weeks while the Polkadot price pushed higher.
Therefore, the short-term Polkadot price prediction is bearishly biased. The market needed time to reset and consolidate. This could take a week or a month, depending on the market-wide sentiment and Bitcoin’s [BTC] momentum.
While this consolidation is expected to lead to a short-term range formation, the higher timeframe uptrend remained intact. A drop below $8.56 and $7.55 would be necessary to shift the higher timeframe bias bearishly. This is unlikely based on the evidence at hand.
If the $10.5 level is flipped to support, DOT bulls would target $16.35 and $23.85 resistances in the coming weeks.
Where would the next buying opportunity be?
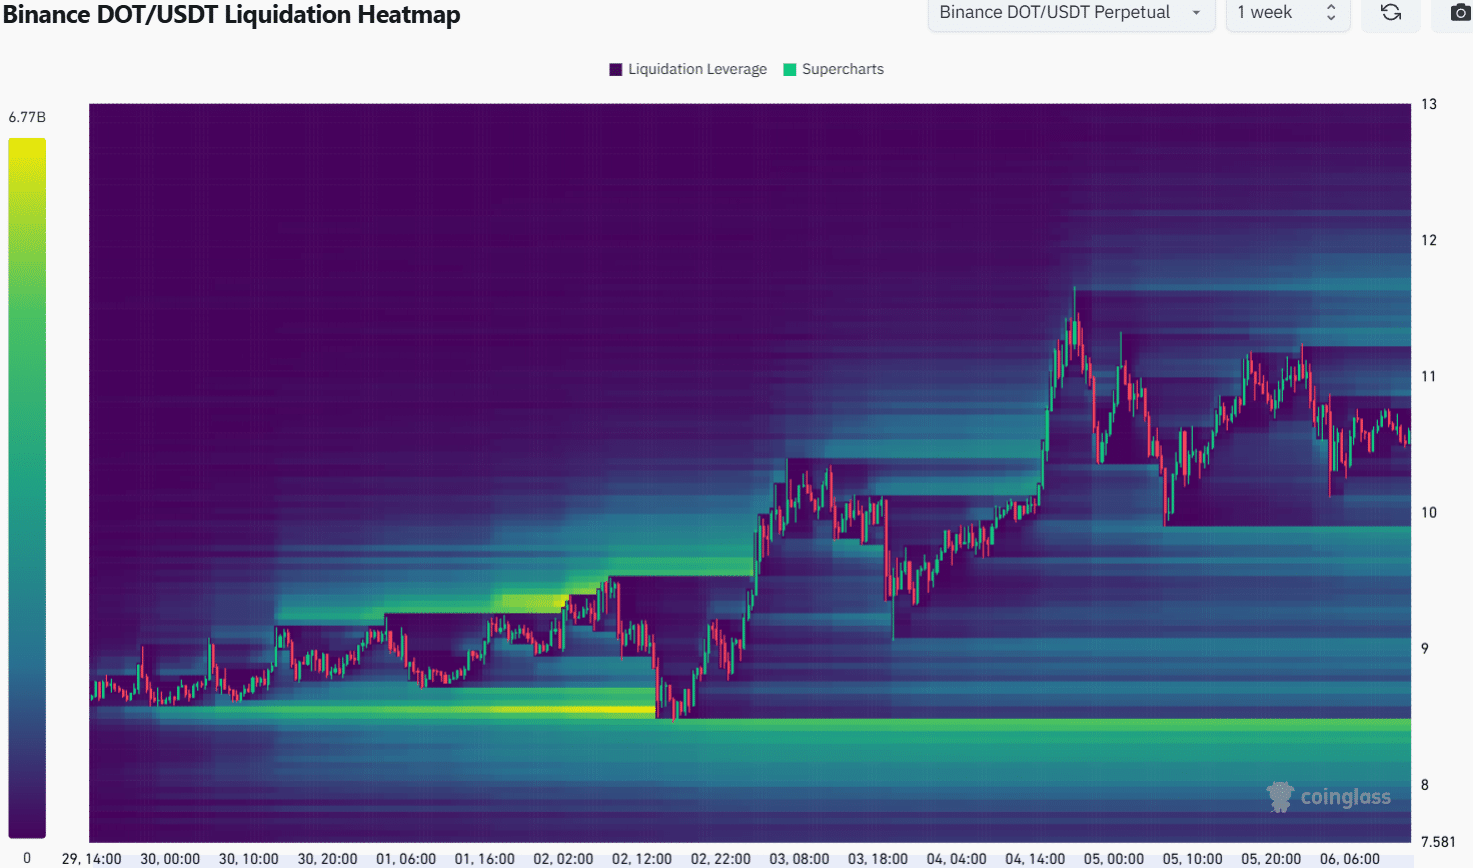
Over the past ten days, the key support levels at $7.4 and $8.4 have seen a build-up of liquidation levels around them. This signified their importance and reinforced the findings on the daily price chart.
Is your portfolio green? Check the Polkadot Profit Calculator
The past week’s liquidation heatmap outlined the $9.9 and $11.3 regions as near-term magnetic zones. It is possible that DOT would be attracted to these levels and form a range in the process.
However, traders should be prepared for the potential drop to $8.4 or lower.
Disclaimer: The information presented does not constitute financial, investment, trading, or other types of advice and is solely the writer’s opinion


