Polkadot short-term Price Analysis: 08 December

Disclaimer: The findings of the following article are the sole opinion of the writer and should not be taken as investment advice
Polkadot has been witnessing great selling pressure as its price climbed down to $4.83. This sudden fall in its value was a reaction to the falling Bitcoin market, which has sunk under $19k, at press time. This pressure pushed DOT’s value to $4.87, at press time, as it tried to recover.
However, the recovery effort currently looks like a consolidating phase in the DOT market.
Polkadot 1-hour chart
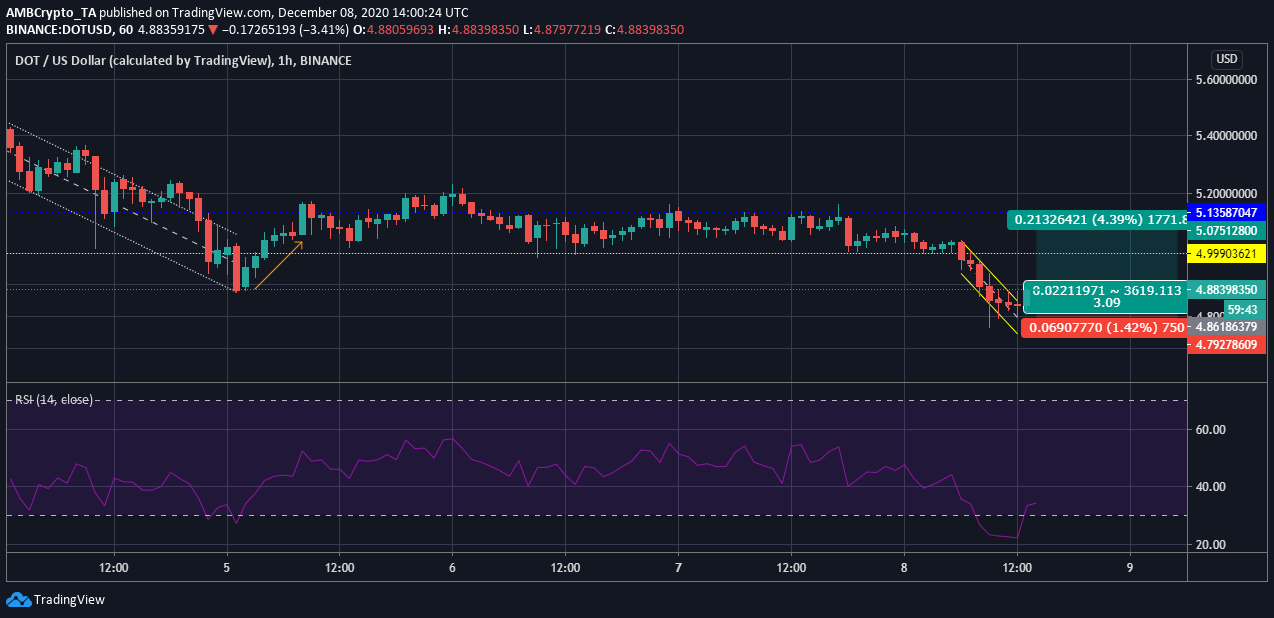
According to the chart above, DOT’s value has been falling down the price ladder forming a descending channel. However, as the selling took a halt, the recovery of the asset began promptly. As the fall was sudden, there could be a boost in DOT’s value which could be a good time to open a long position.
Reasoning
The current sell-off pushed DOT to the oversold zone as it slipped under the support at $4.99. This slip caused the digital asset to enter the oversold zone as noted by the Relative Strength Index. The recovery effort did push the coin above the oversold zone.
However, the signal line has been moving parallel to the lower limit of the RSI, noting a sideways movement of DOT. The value of DOT, in order to stabilize, may witness a rise that could carry its price above the immediate resistance at $4.99. Thus traders can assume a long position and enter at $4.88.
Position
Entry: $4.88
Stop-Loss: $4.79
Take-Profit: $5.07
Risk-to-Reward: 2.24
Conclusion
The current price of the digital asset has been trying to recover, thus, a long position could manage to offer better gain for traders in the short-term. With the asset just moving above the oversold zone, a stabilizing price could rise higher and may surpass the immediate resistance sooner or later.