Polkadot: Should DOT investors expect a rally in the face of a dead cat bounce

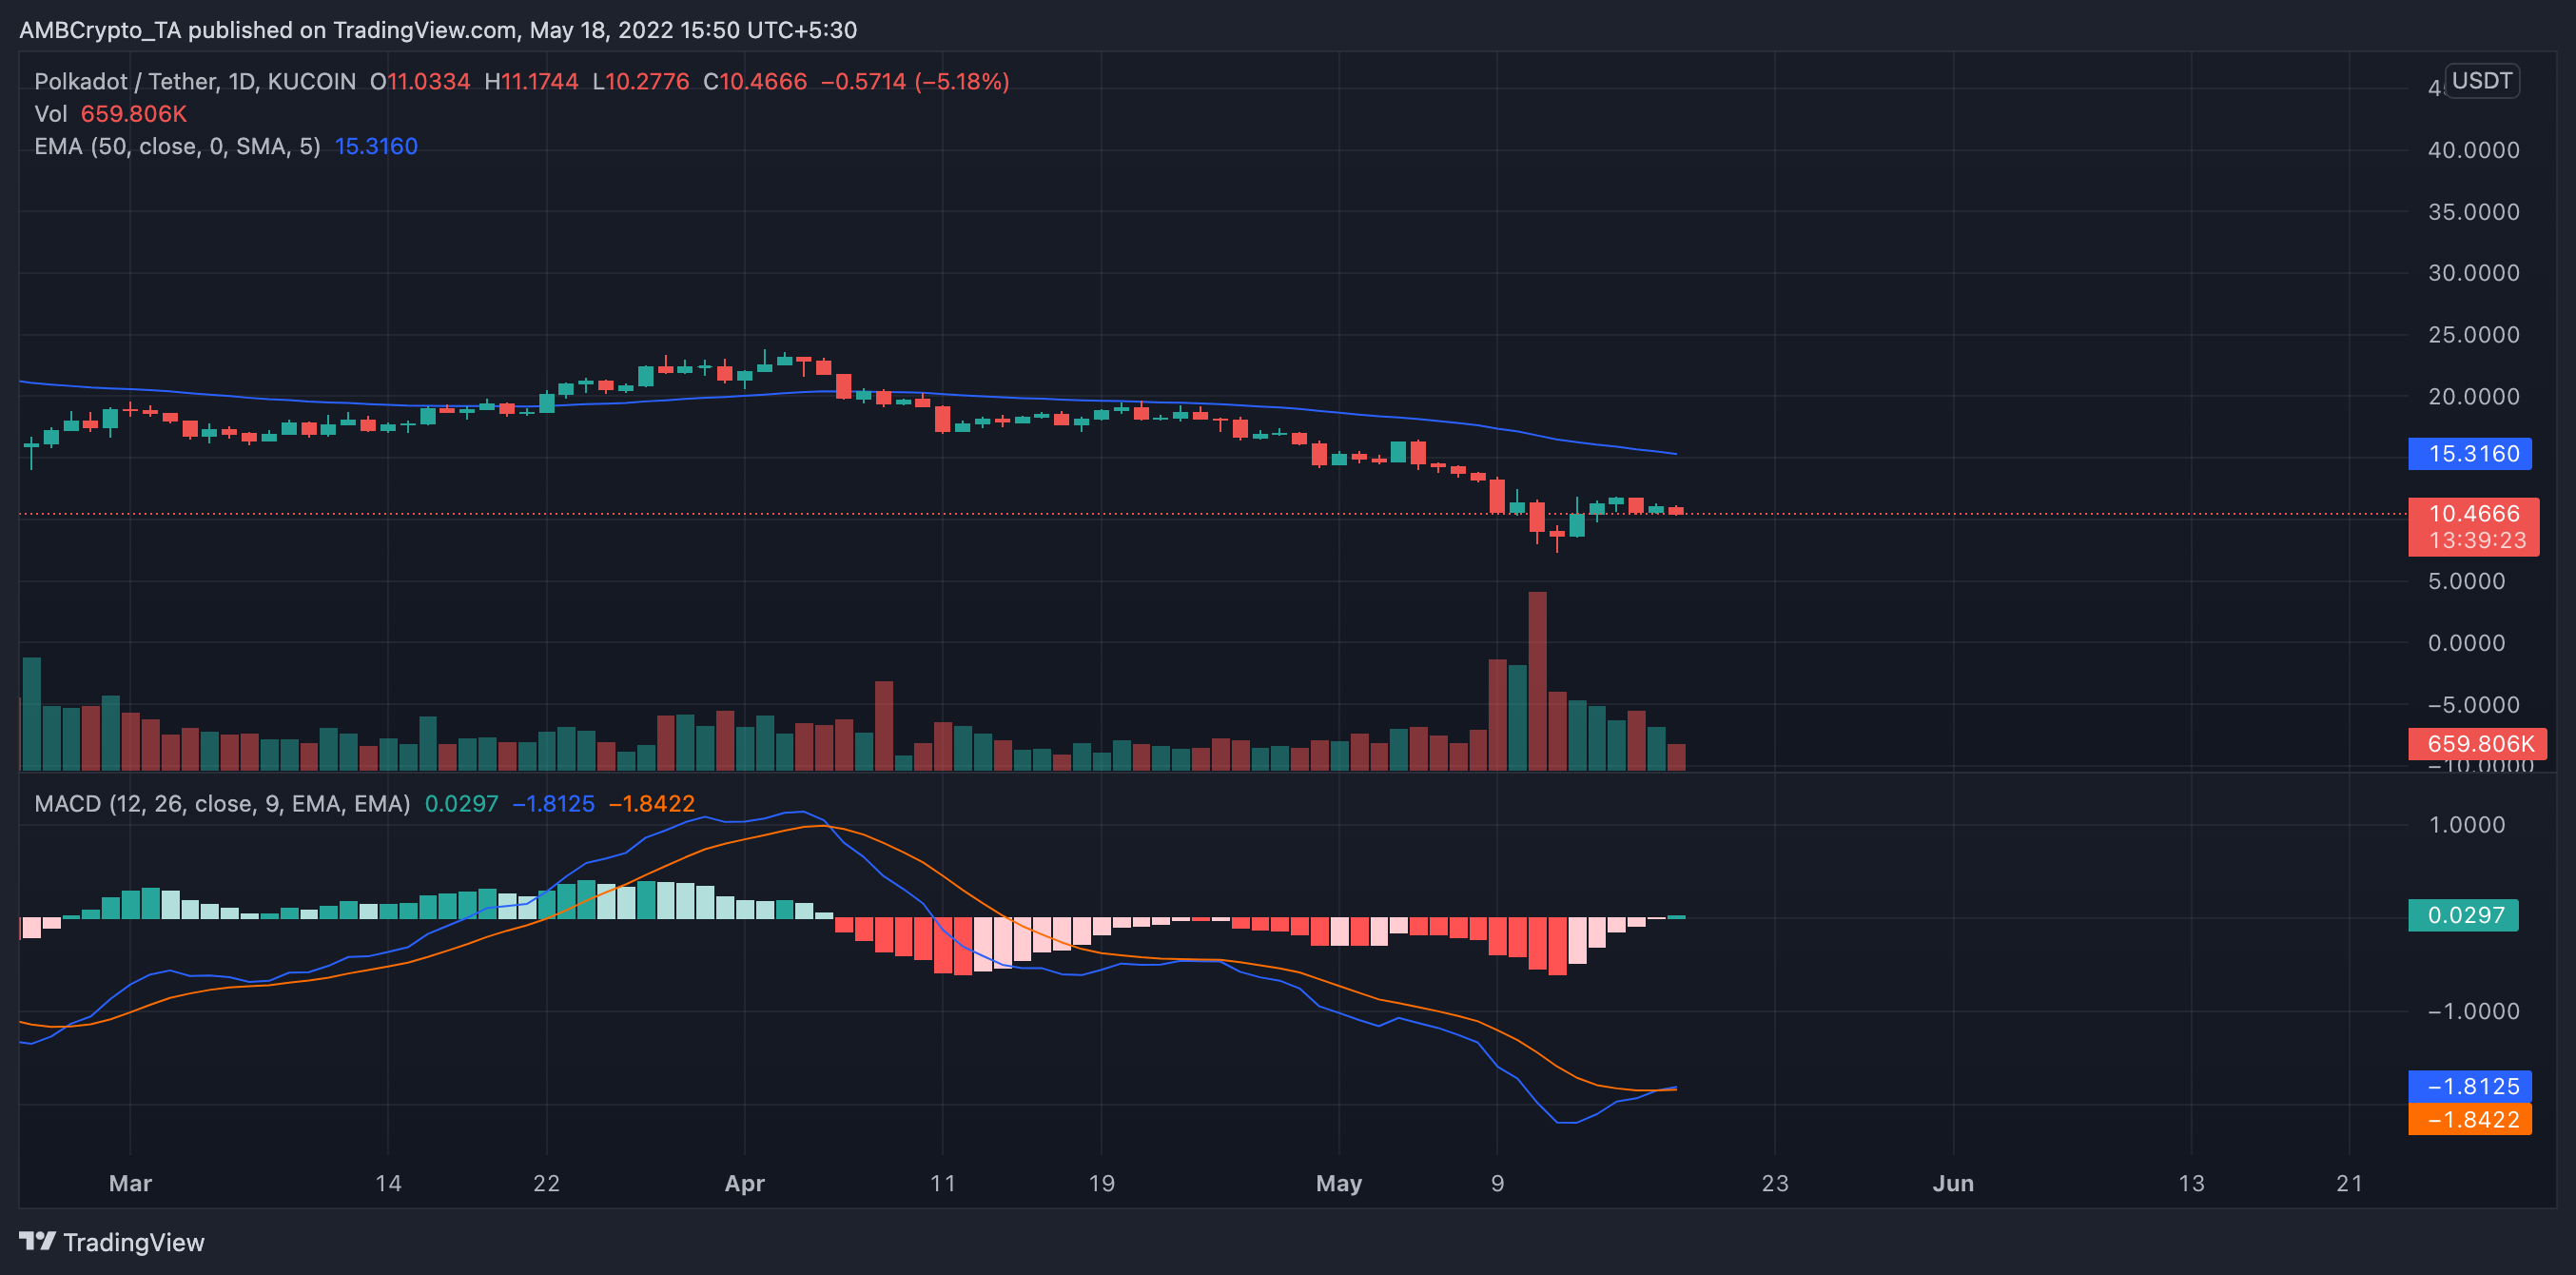
The entire crypto market is trying to recover from the recent crash. However, in the case of the Polkadot token, after breaking out of a symmetrical triangle pattern on 17 May and trading above the $10 level, the bears appeared to have spotted the coin.
How so?
After recording a high of $11.29 during intraday trading on 17 May, the bears forced a retracement. This made the DOT token shed 7.24% in under 24 hours, pegging the price per DOT token at $10.36 at the time of press.
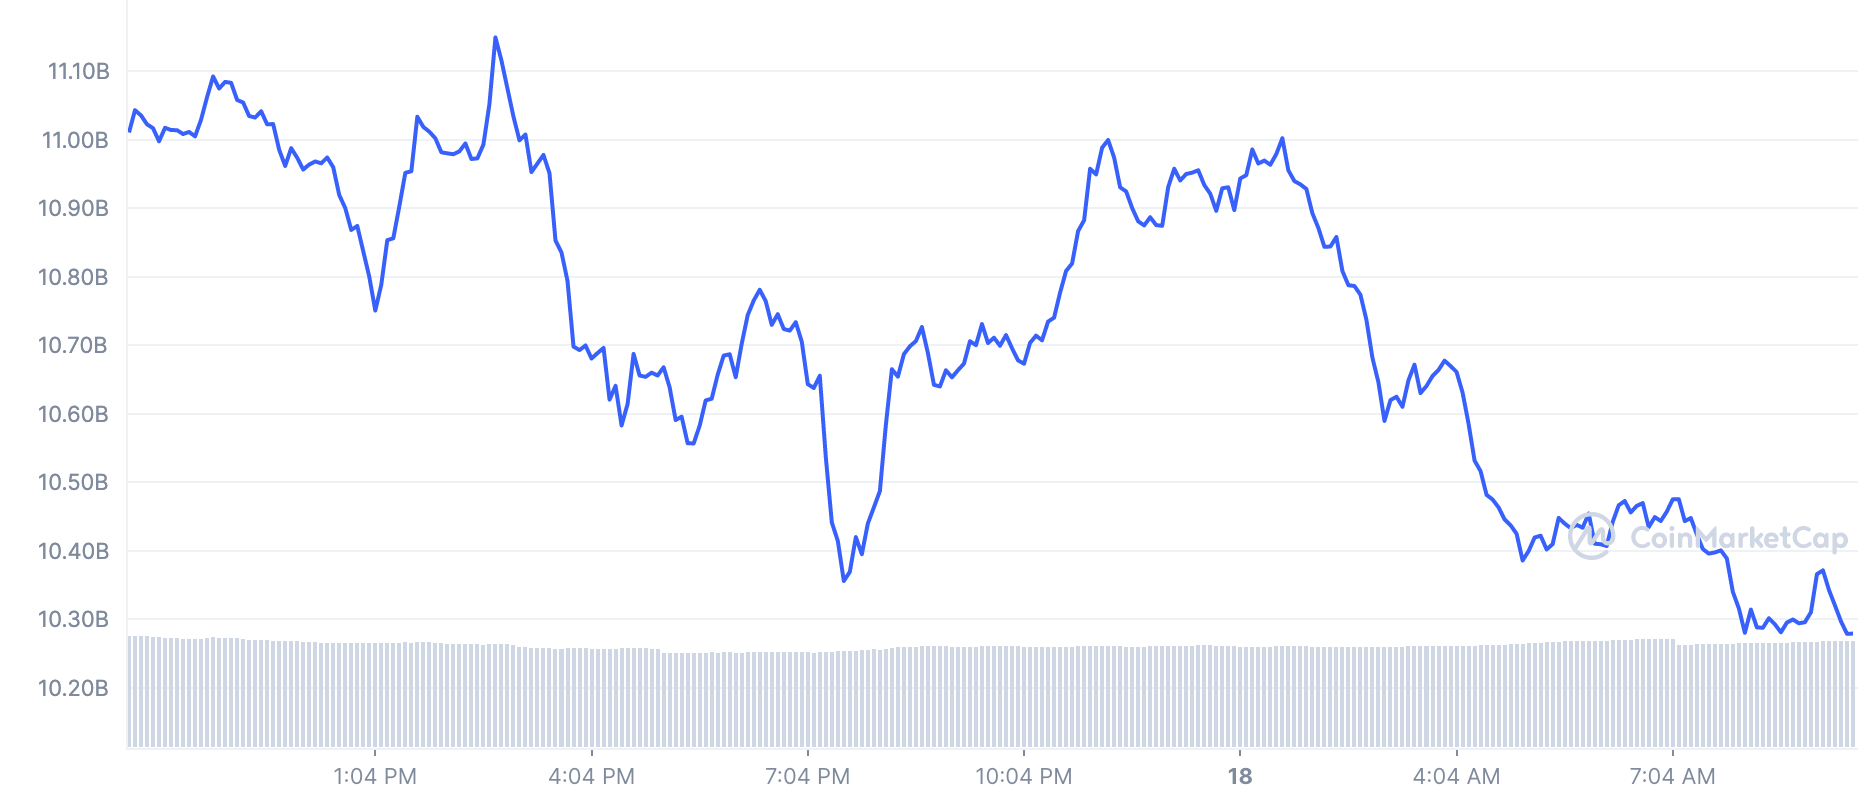
Similarly, the market capitalization of the coin experienced some plunging. Recording a high of $11.2b during intraday trading on 17 May, this has since retraced and stood at $10.23b at the time of press.
Following an increased bearish bias, trading volume has since dropped and stood at $802,571,063. This represented a 4.235 decline in the last 24 hours.
No place to run to
On-Chain analysis of DOT’s performance in the last 24 hours revealed that all might not be well with this token.
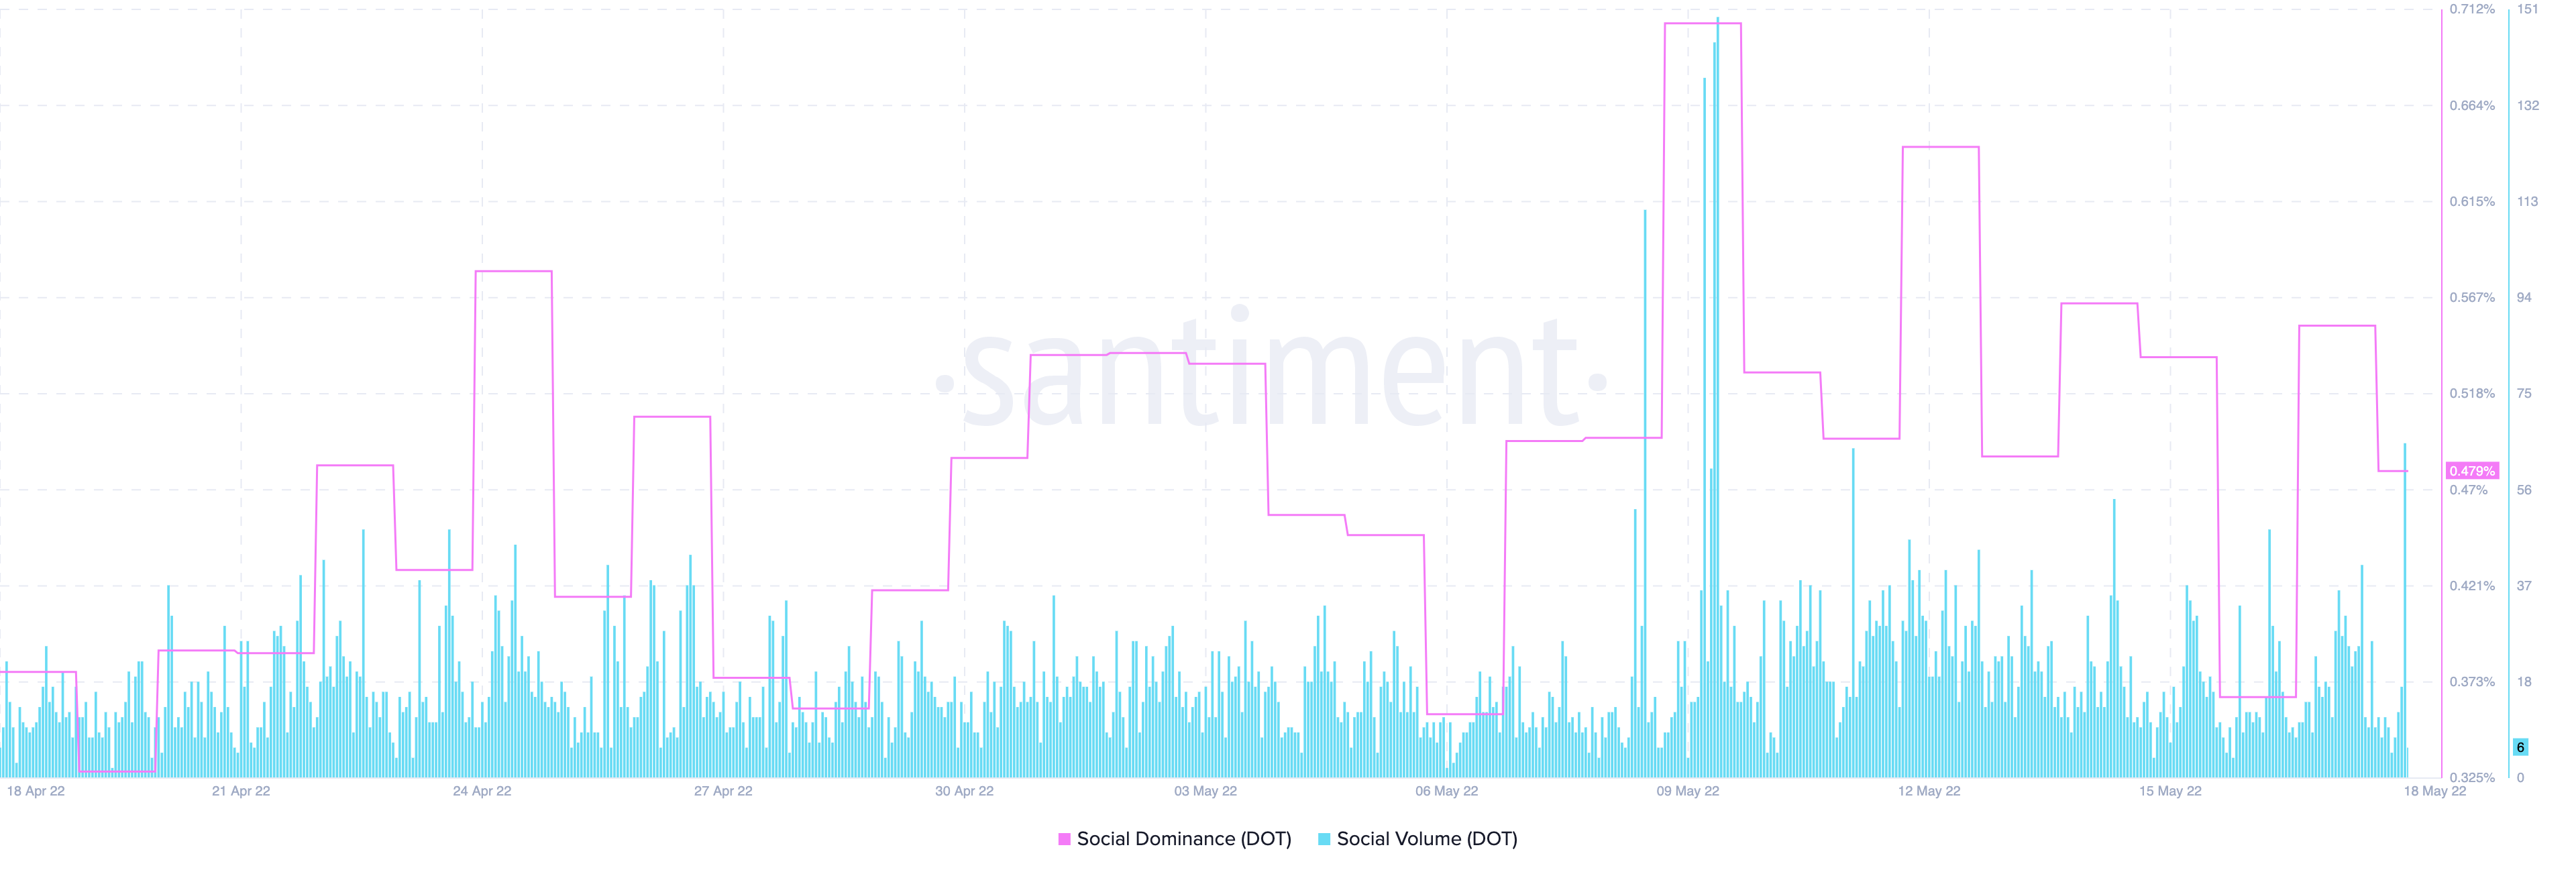
From a social angle, the token appeared not to have enjoyed much social rep in the past couple of days. Despite the announcement of its upcoming Polkadot Decoded Event, the social metrics have taken on a downtrend over the past few days. 152 at the time of press, the social volume after recording a high of 887 nine days ago declined by 82%.
Similarly, the social dominance, attempting to record a spike following the intraday high of 17 May, was forced downwards and stood at 0.479% at the time of press.
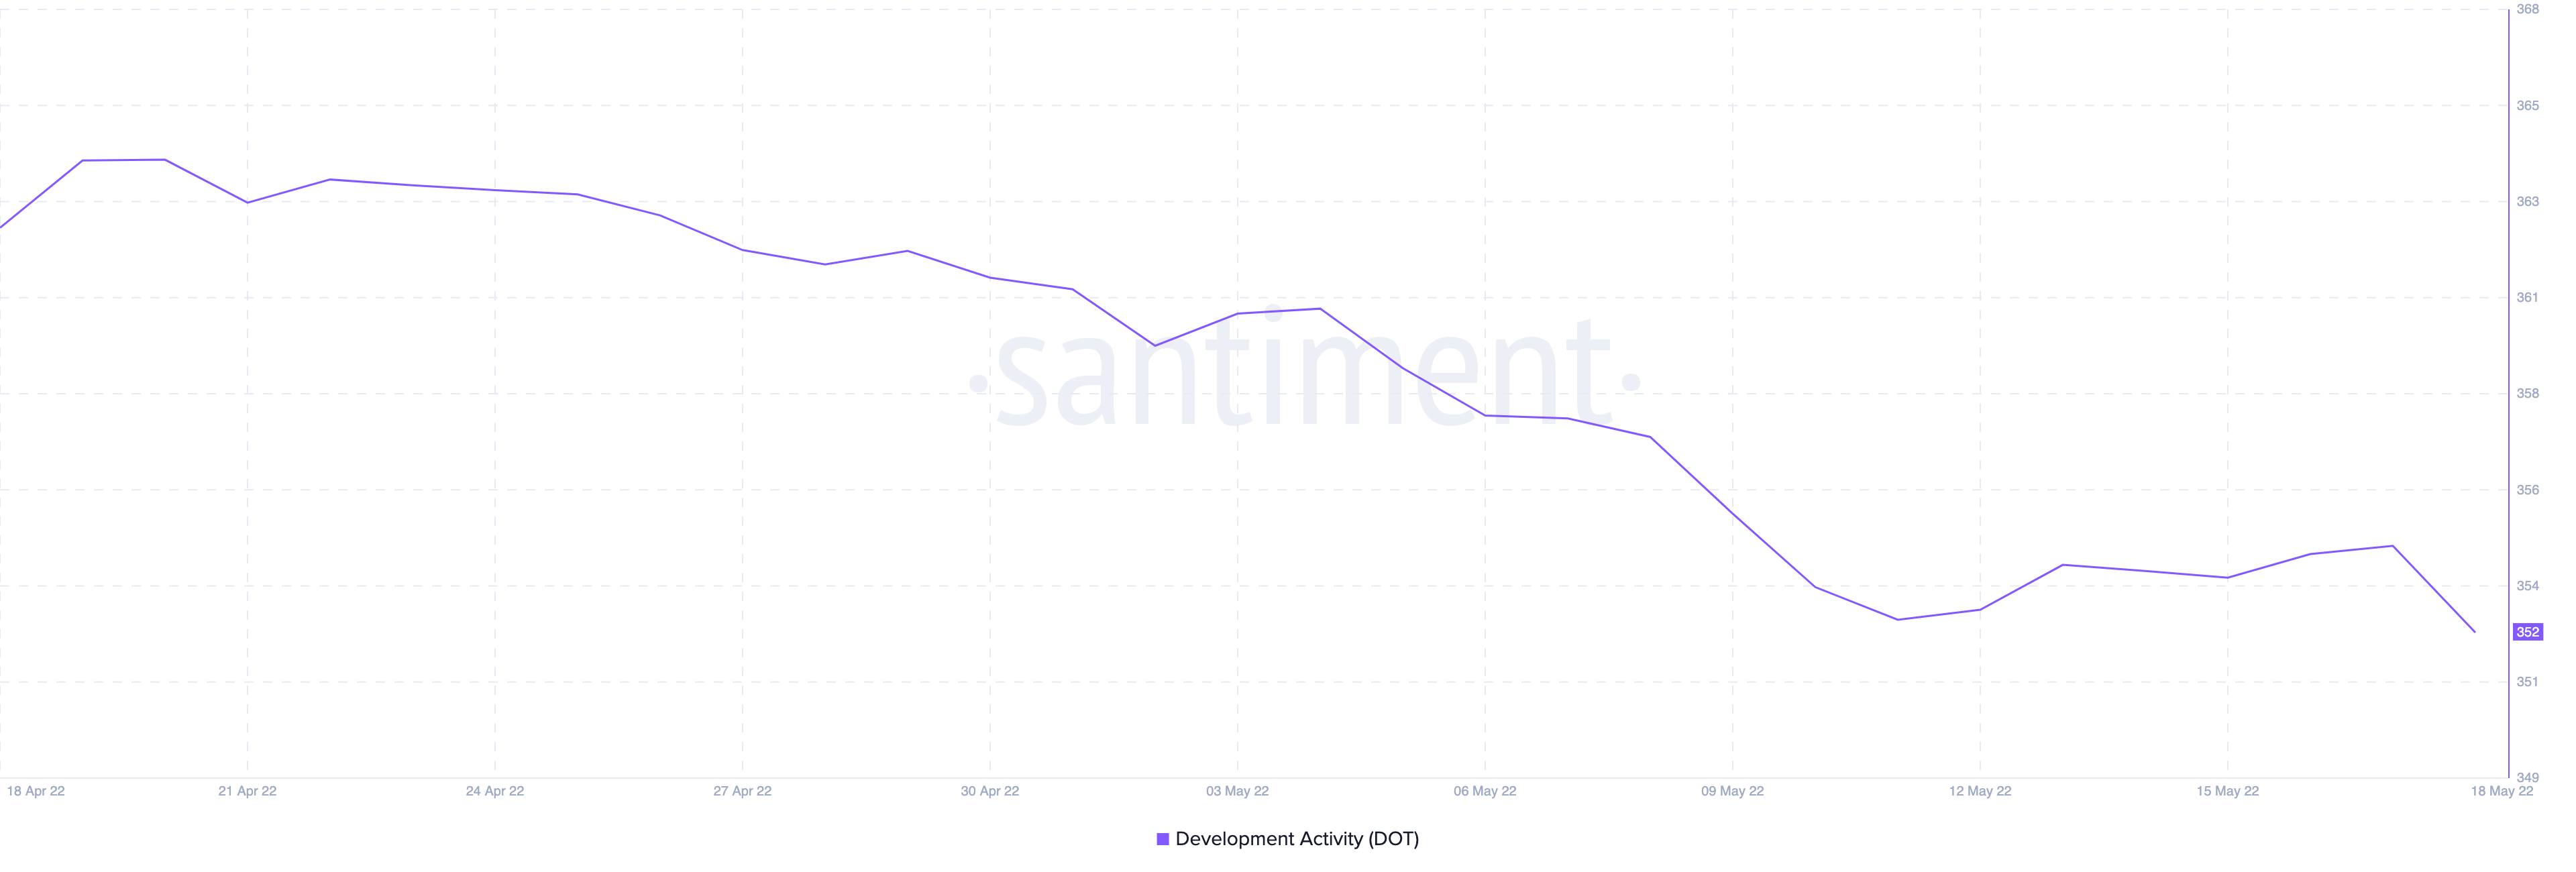
On a developmental front, on-chain data showed no meaningful growth over the last few weeks. May has been marked by a steady decline in the index for development activity for the DOT token. This stood at 352 taking on a downward progression at the time of writing.
Interestingly, before you lose all hope as an investor, you should note that a MACD bullish crossover was observed at the time of press. Marking their positions below the histogram bars, the MACD line intersected the trend line in an upward direction indicating a long-term bullish outlook.


![Ethereum [ETH] targets $1,810 – Will THIS crucial level ignite a breakout?](https://ambcrypto.com/wp-content/uploads/2025/04/Gladys-59-400x240.jpg)