Polkadot, Tezos, Aave Price Analysis: 30 January

While Bitcoin’s 4-hour 20 SMA jumped above its 50 SMA, the crypto-market registered a decent recovery over the past three days. Consequently, Polkadot and Tezos saw bullish patterns on their charts.
On the other hand, Aave seemed to consolidate in an up-channel while forming a bearish flag. However, Polkadot and Aave still struggled to gather trend committing volumes.
Polkadot (DOT)
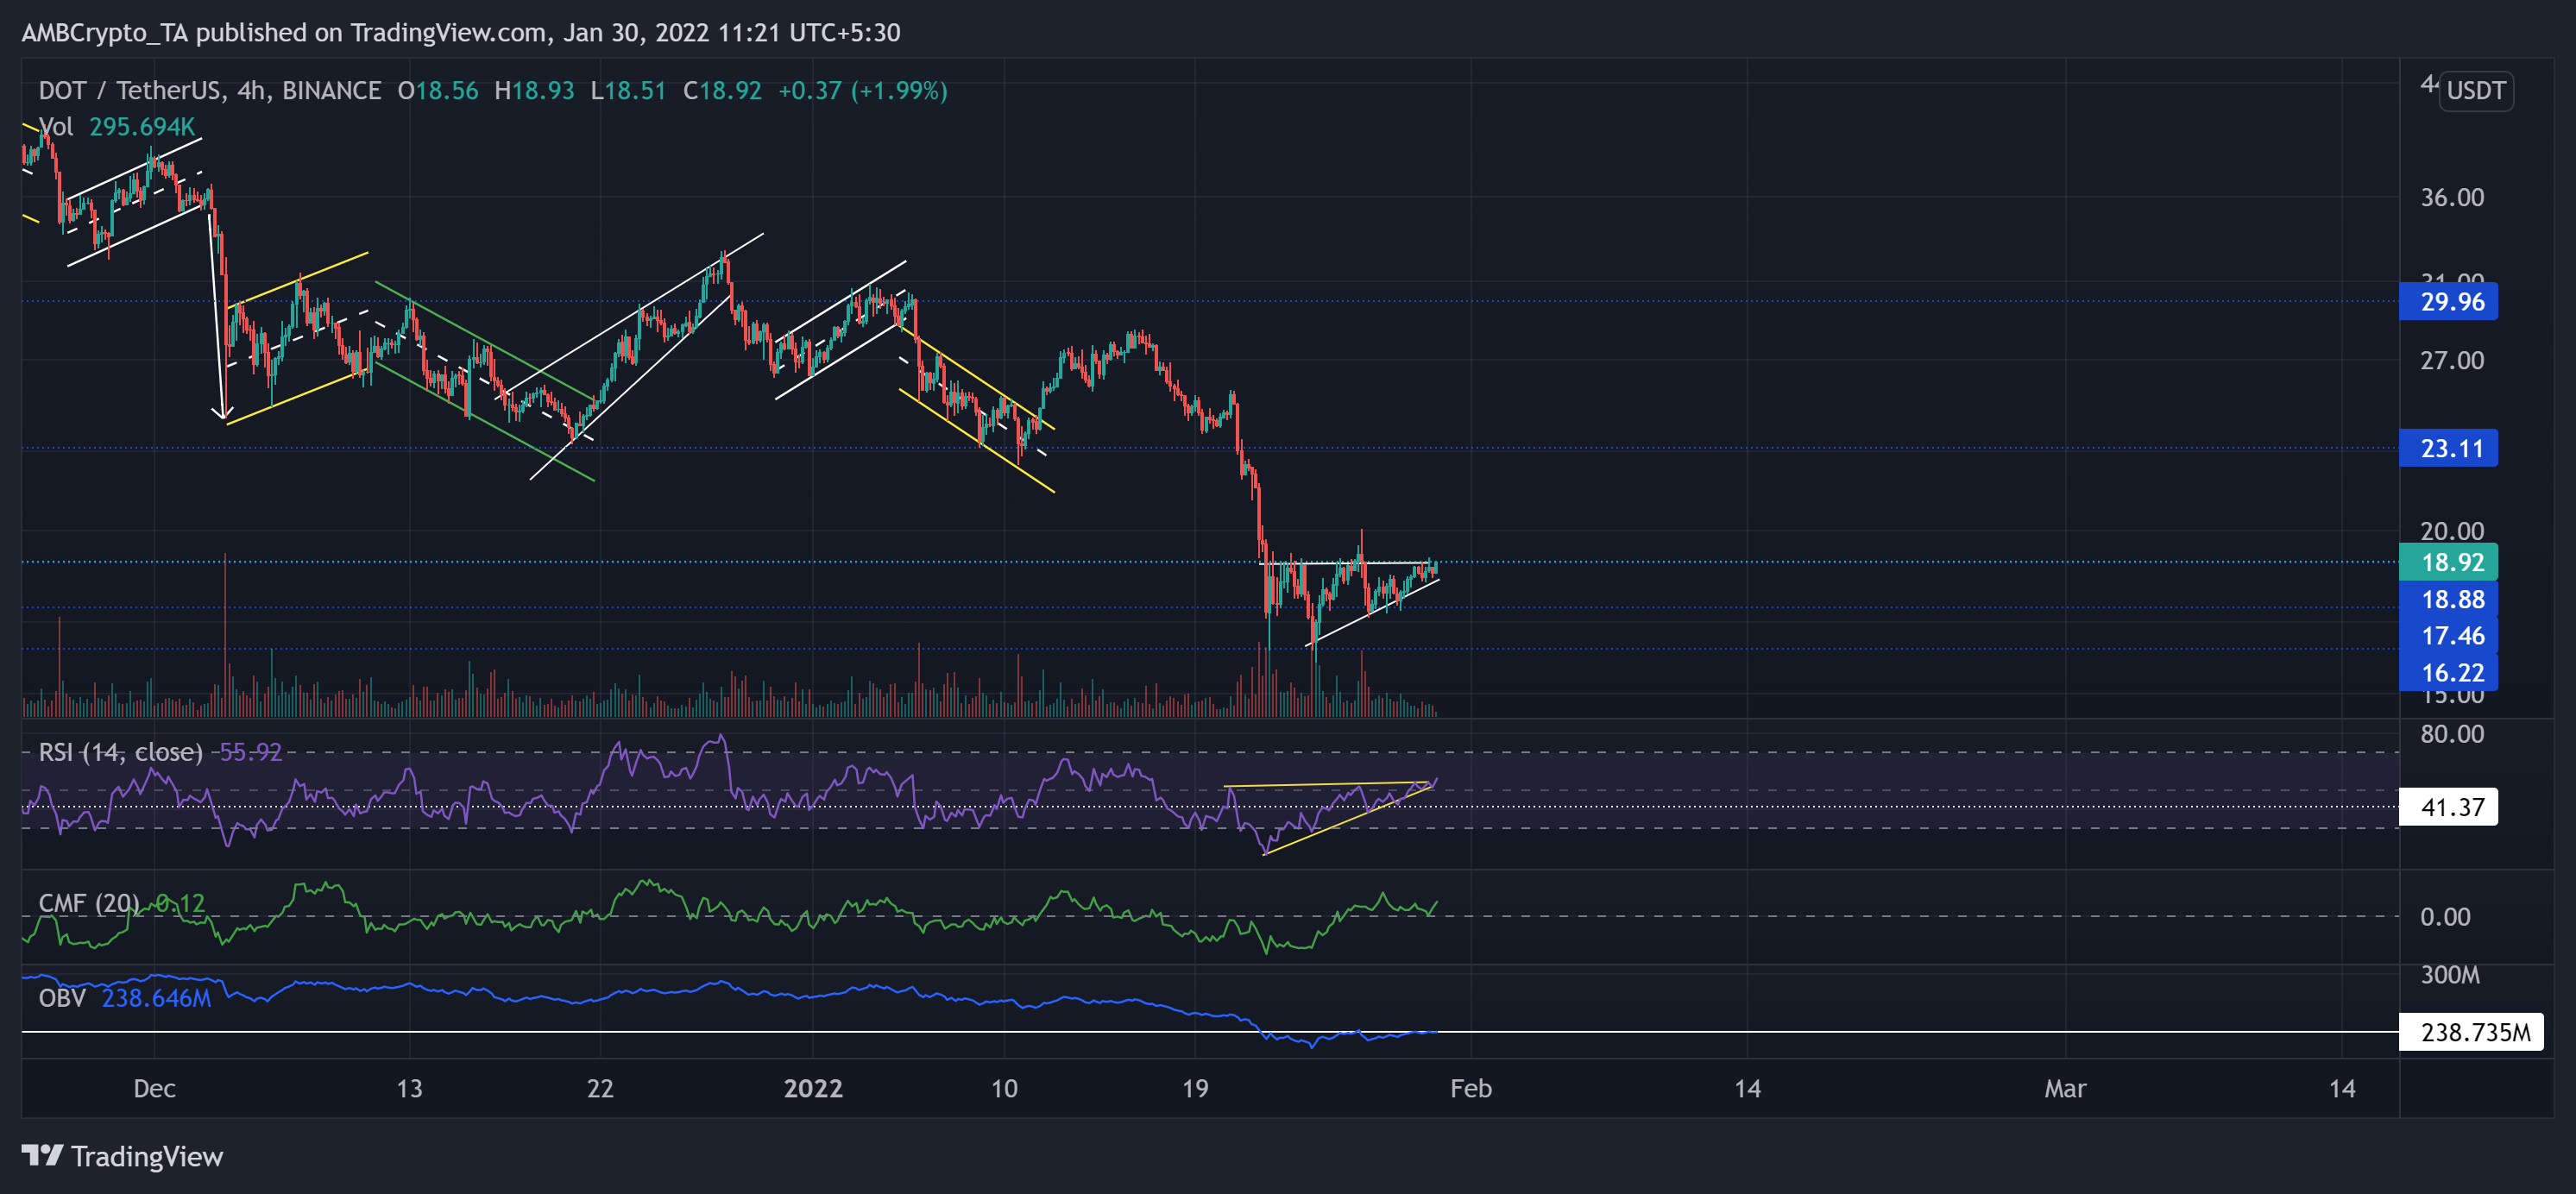
After oscillating sideways for nearly seven weeks, the 21 January sell-off led DOT to lose its oscillating range of $29.9-$23.11. Since then, the bears have taken over as they flipped the $23.11-mark five-month support to resistance.
The altcoin rushed to touch its 25-week low on 24 January, post a 38.34% decline (from 20 January). Over the past few days, DOT formed an ascending triangle (white) on its 4-hour chart as the bulls exerted increased pressure.
At press time, the alt was trading at $18.92. The RSI stood at the 55-mark. After testing the oversold region, it saw a nearly 39 point revival and crossed the midline. While being in congruence with the price, for the most part, the immediate support stood at the 50-mark. Further, the CMF managed a recovery above the midline and displayed a bullish bias. However, the OBV still could not topple its immediate resistance.
Tezos (XTZ)
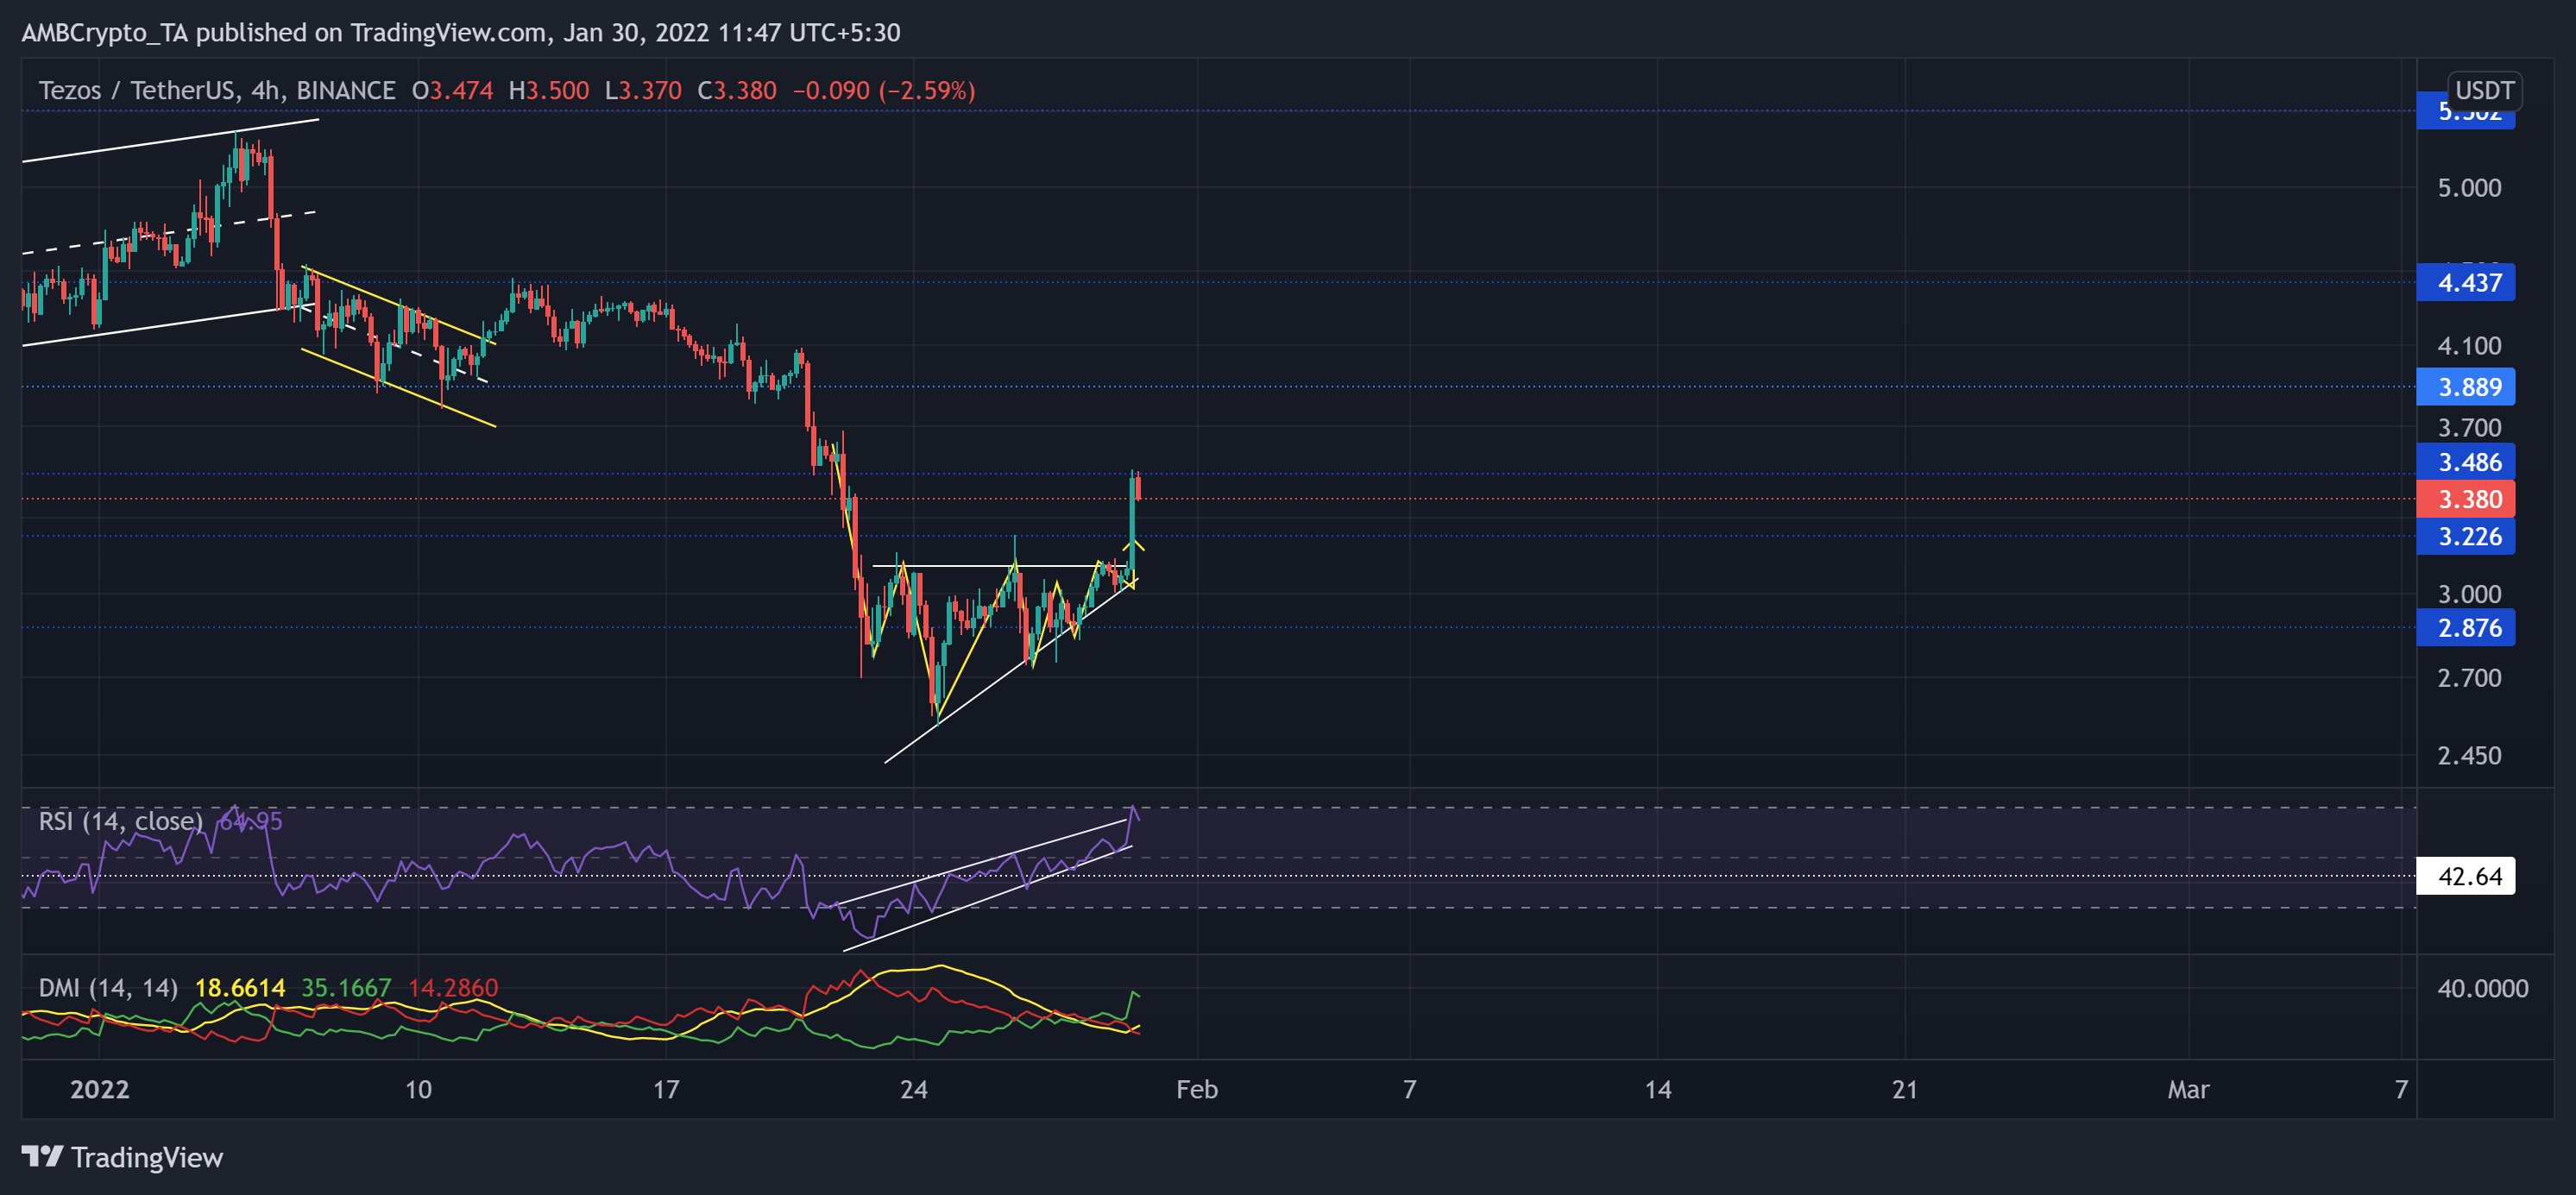
Ever since breaking down from its up-channel (white) on 7 January, XTZ bears took over. They breached the $3.8-mark five-month resistance (previous support). XTZ registered a 51.6% decline (from 5 January) and hit its six-month low on 24 January.
Like DOT, XTZ also pictured an ascending triangle over the last few days. Then, the patterned breakout found resistance at the $3.48-level. Now, the testing point for the bears stood at the $3.2-mark.
At press time, XTZ traded at $3.38. After plunging to its record low on 22 January, the RSI saw a steep surge while forming an up-channel. As a result, it tested the overbought region on 30 January before a slight plunge. Also, the DMI noted a bullish bias while the ADX confirmed a weak directional trend for the alt.
AAVE
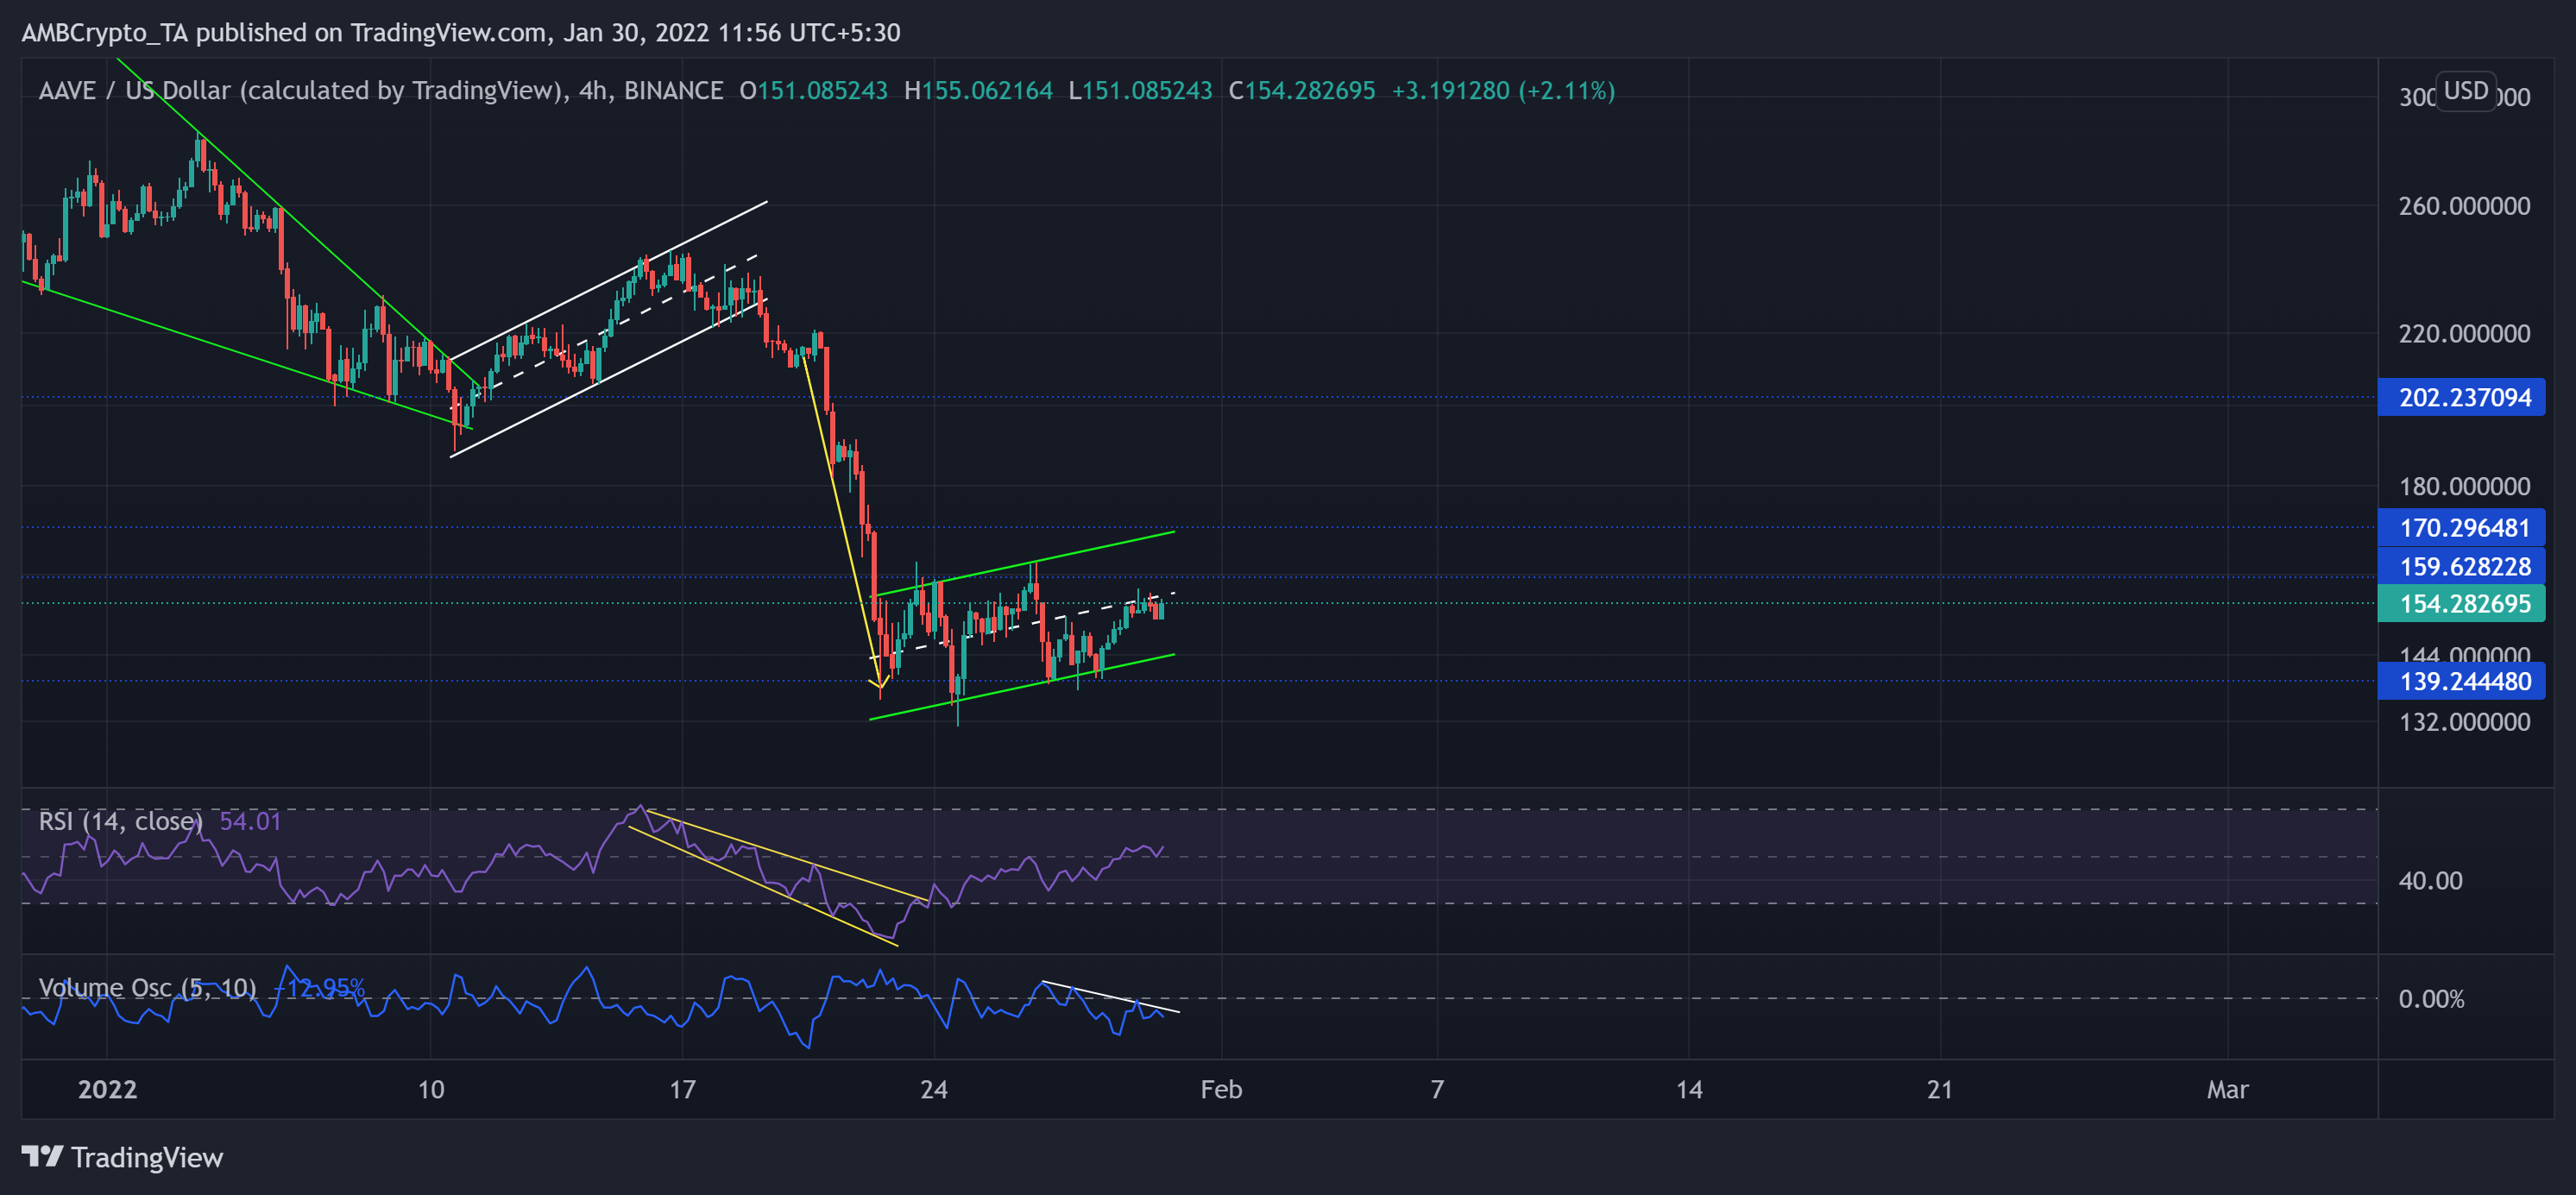
After its up-channel (white) breakdown, the sellers took charge as bulls lost their edge and failed to defend the $202-level resistance (previous support).
AAVE lost over 45.95% (from 16 January) of its value until it poked its year-long low on 24 January. Now, the midline of the up-channel (green) stood as an immediate testing point for bulls. Further, the $159-mark continued to stand as a strong barrier for them.
At press time, AAVE was trading at $154.28. The RSI crossed the midline and saw a solid recovery after breaking out of the descending broadening wedge on 24 January. Further, AAVE’s Volume Oscillator depicted weak signs as it marked lower peaks and dropped below equilibrium.


