Polkadot, VeChain, Algorand Price Analysis: 10 January

Polkadot fell from record levels and was trading between a thin channel as it entered a consolidation phase. VET also moved lower from peak levels but bulls managed to halt the movement at $0.029. Indicators on VET gave mixed signals for the future trajectory of prices. ALGO was showing bullish movement at the time of writing and a rise towards a newer local high could be possible.
Polkadot [DOT]
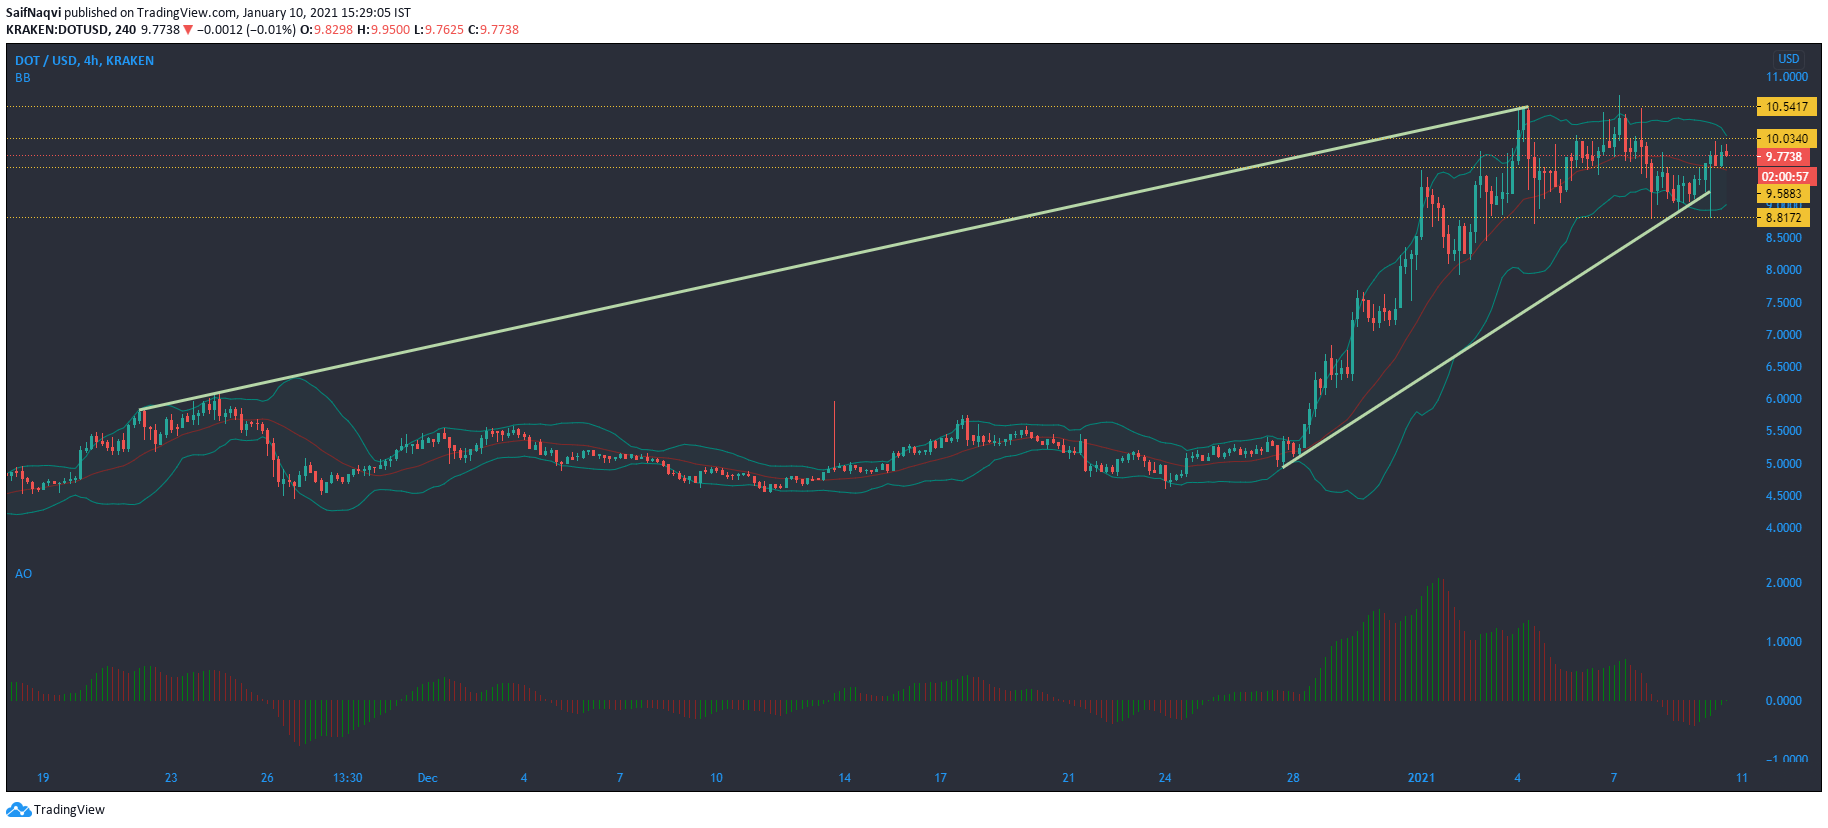
DOT has struggled to rise above resistance at $10.54 over the past week, despite multiple attempts by the bulls. In fact, after breaching its all-time high a few days back, a correction dragged prices lower by 12% on the charts. After the fall, support at $9.49 provided some relief and DOT moved towards the immediate ceiling at $10.03. Moving forward, a bit of sideways movement can be expected and DOT could trade within its present channel of $10.03 and $9.58.
The Awesome Oscillator was bullish-neutral as the green bars were looking to rise above the equilibrium point.
The Bollinger Bands indicated low volatility in price as the bands were converging. In the short term, prices could trade between the signal line and upper band and could reaffirm the consolidation between the current channel.
VeChain [VET]
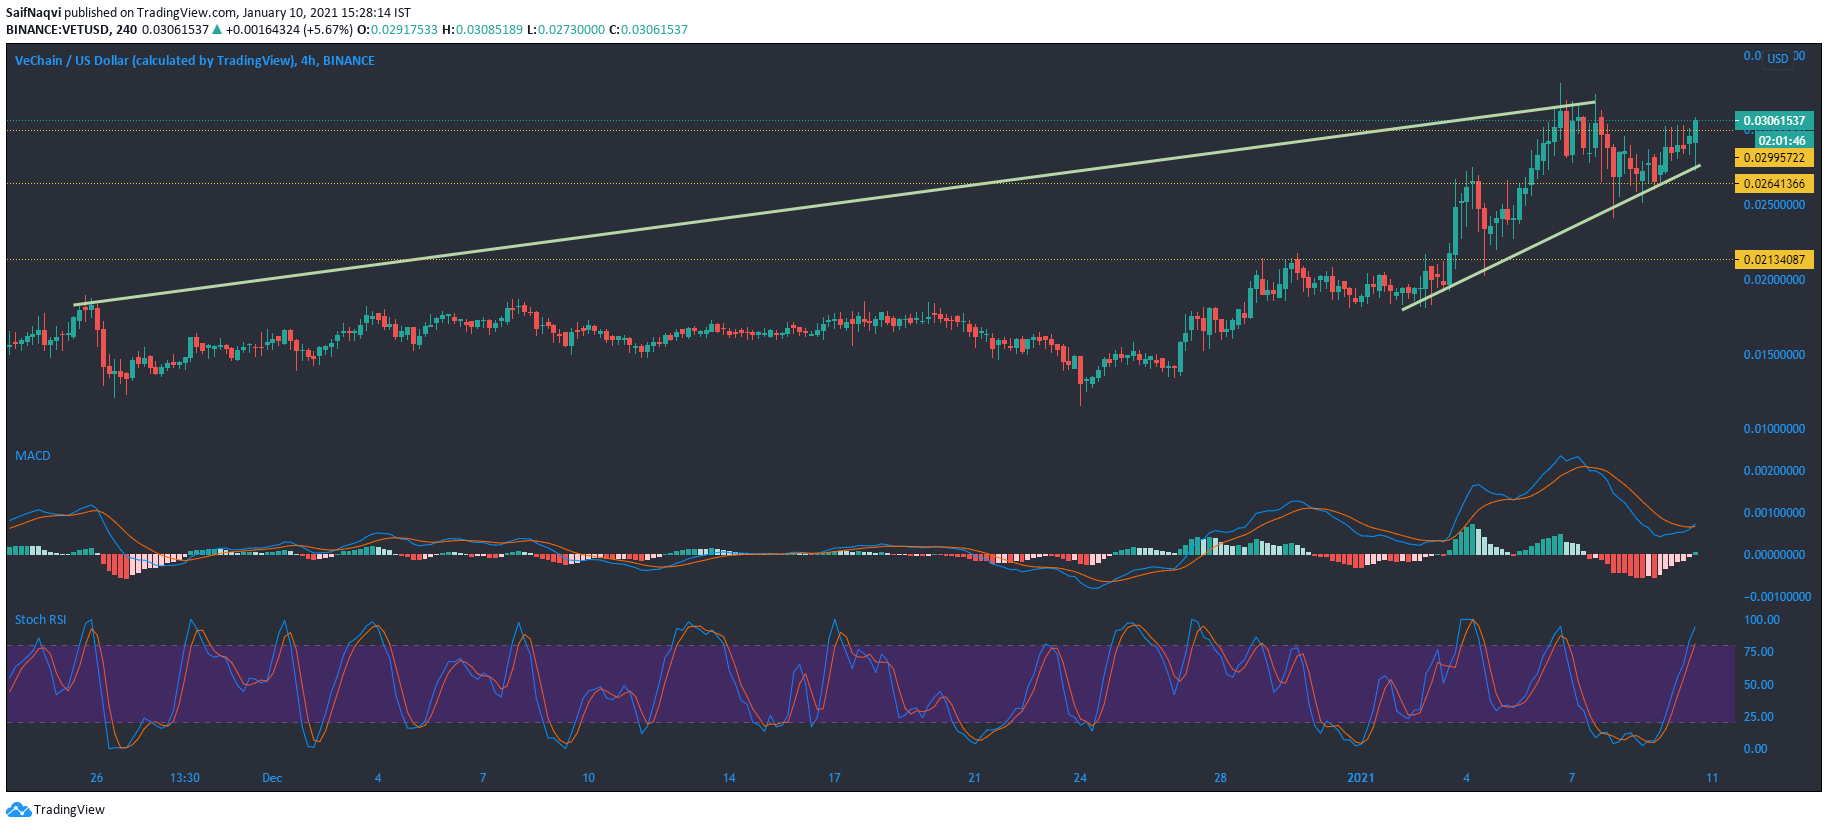
Similar to DOT, VET also fell from its all-time high at $0.031 and the price found support at $0.026 as the bulls prevented a further sell-off. Although the bulls attempted to push prices upwards to record levels, gains were capped at the resistance of $0.029. Currently, momentum rests with neither the sellers nor the buyers, and the indicators suggested that a move in either direction was possible.
A bullish crossover was on the horizon as the MACD’s fast-moving line caught up to the signal line. If the crossover takes place, prices could surge beyond their present resistance level.
On the flip side, the Stochastic RSI hinted at a potential reversal as the index was trading in the overbought region. If the index shoots downwards towards the oversold area, prices could fall below their current support and head towards the next defense at $0.021.
VET was in the news recently after the Mediterranean Hospital of Cyprus announced that 100 doctors and personnel of the hospital received certification for their first dose of the COVID-19 vaccine via a mobile app that was backed by the VeChain Thor Blockchain.
Algorand [ALGO]
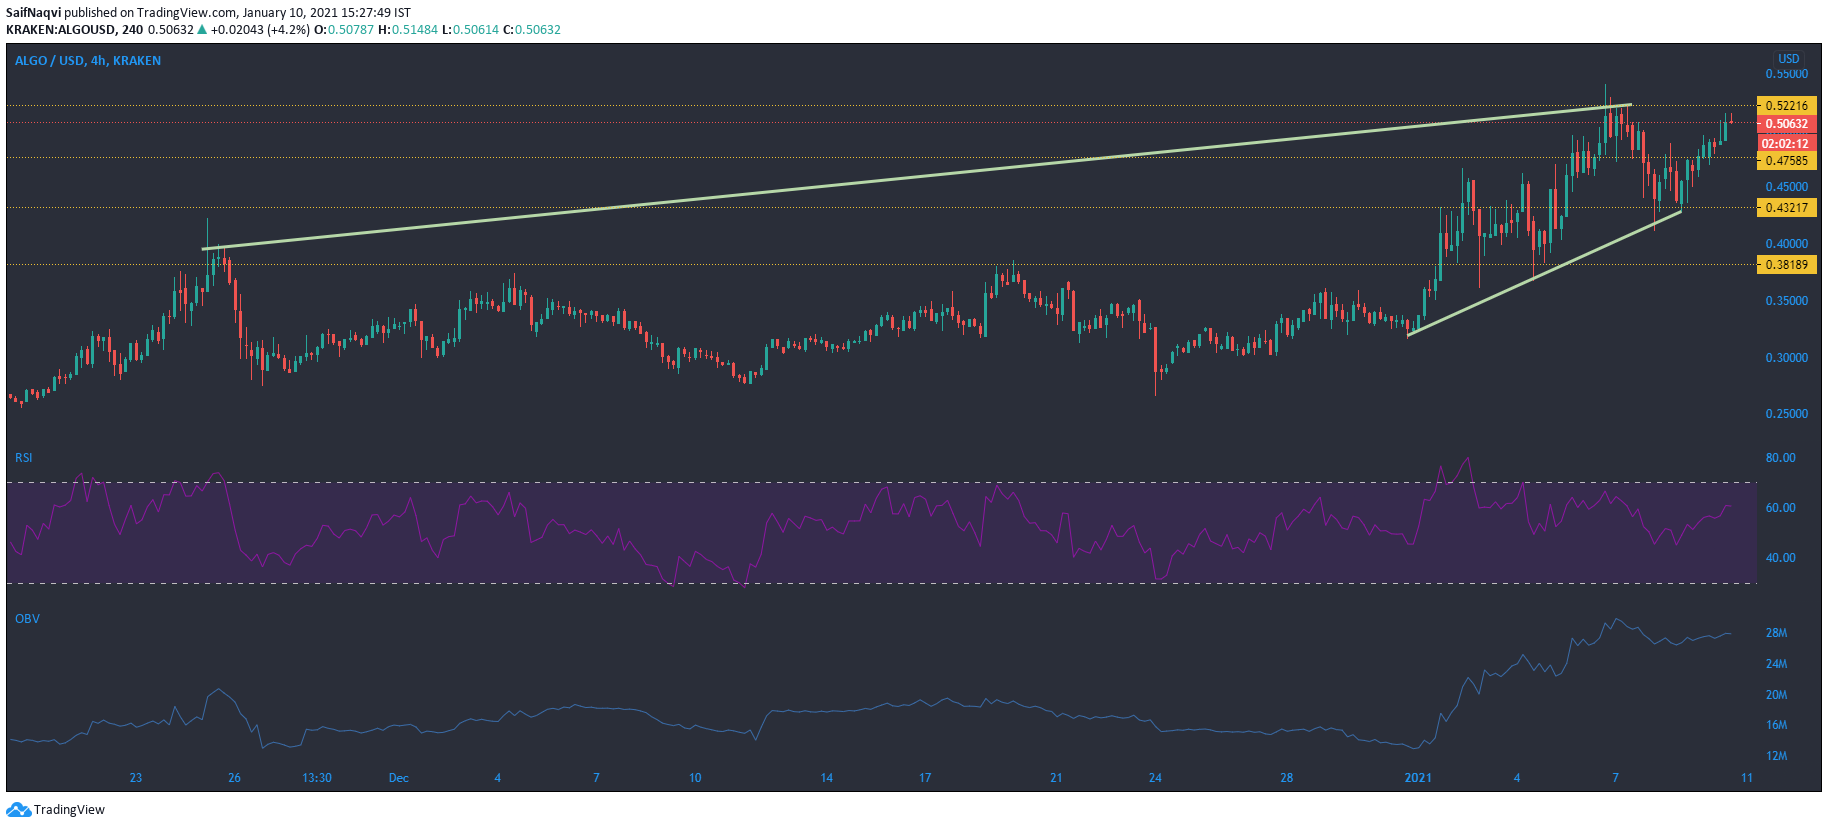
After selling pressure forced prices towards support at $0.432, the bulls regained control and were looking to target resistance at $0.522. The next couple of sessions could be crucial for ALGO’s price as it looks to topple a local high of $0.54, reached four days ago. The indicators suggested that the aforementioned local high could indeed be breached as there was a strong presence of buying momentum in the market.
The Relative Strength Index was moving upwards towards the overbought region, a sign that prices were bullish. In case the index trades in the overbought region, the momentum could drive prices above their immediate resistance.
The On Balance Volume was consistently hitting lower highs since the start of the month, indicating that buyers were driving prices to new levels.