Polkadot: What short-sellers should know about this golden opportunity

Disclaimer: The findings of the following analysis are the sole opinions of the writer and should not be considered investment advice
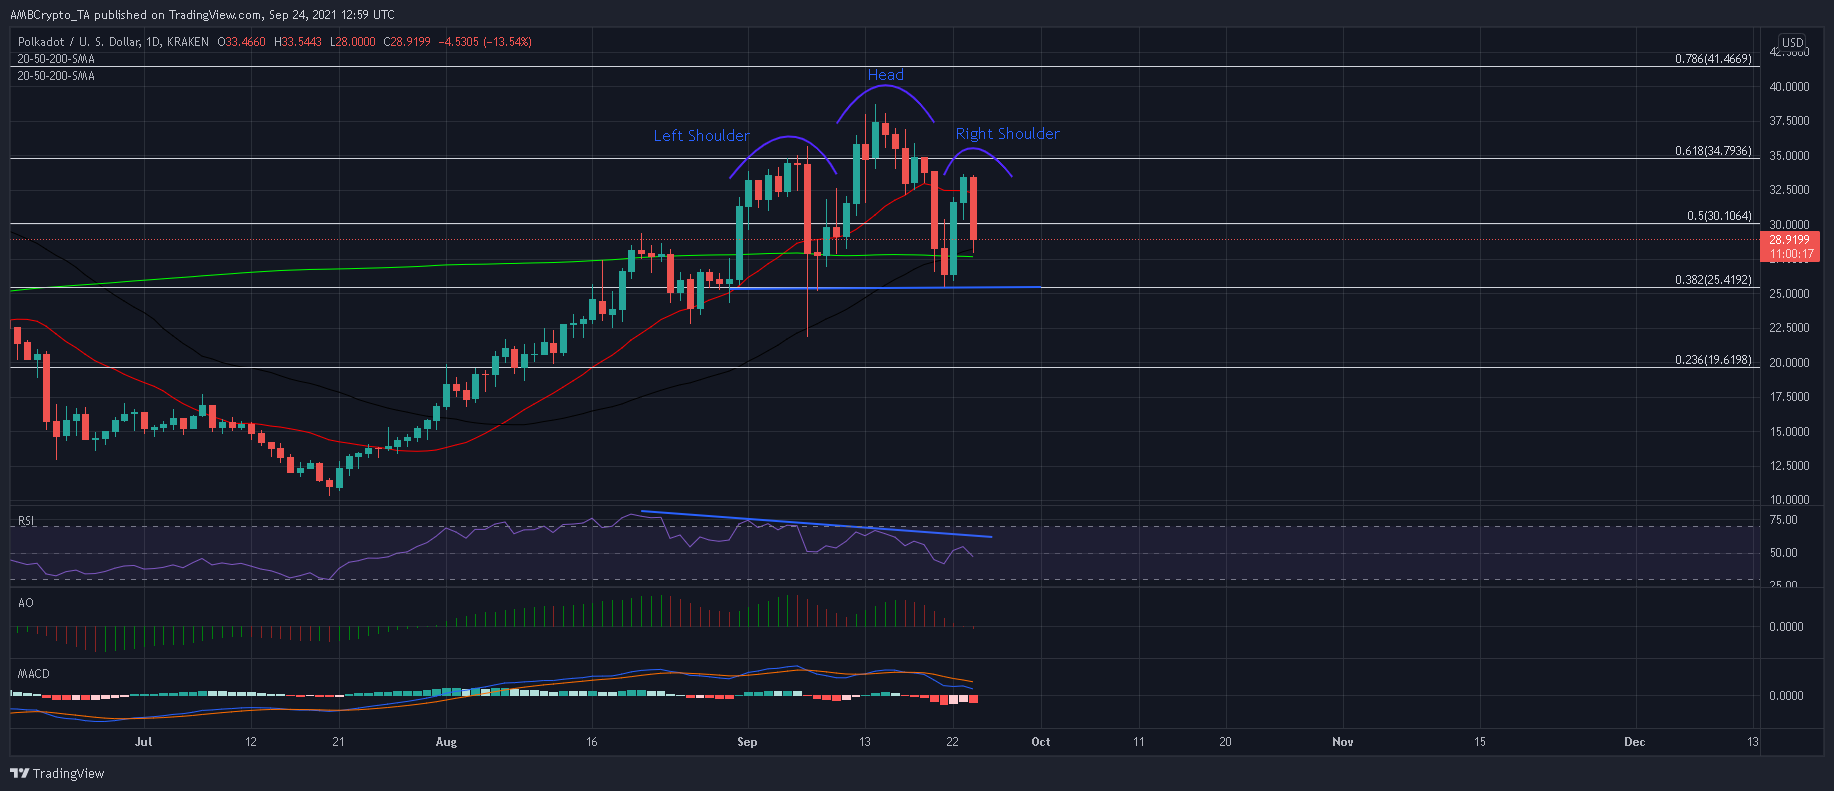
Unable to form a fresher high above $38.7, Polkadot was seeing another southbound leg on the charts at press time. A close below the 38.2% Fibonacci level would allow DOT to snap a newer low around the $20-mark, thereby opening a route to $17 and $10.3.
On the other end, bulls would look to immediately respond at the 200-SMA (green) to avoid an extended sell-off. At the time of writing, DOT was trading at $28.9, down by 6.2% over the last 24 hours.
Polkadot Daily Chart
While some alts have fallen off the rails since mid-August, the same cannot be said about Polkadot. The alt continued to spring higher highs in September, supported by steady inflows into a constantly expanding ecosystem. However, its movement on the chart seemed to come to a disruptive end.
After rebounding from the 38.2% Fibonacci level, DOT was unable to create a higher above $38.7. Moreover, a possible head and shoulders pattern was in formation – A bearish setup which often results in a breakdown below the ‘neckline’ ($25.4).
If sellers do respond to such signals, DOT would be under the threat of a another sell-off towards the $20-mark. From there, the July levels of $17 and $10.3 would come under the spotlight.
There was not much to go on for the bulls. The zone between the 200-SMA and 38.2% Fibonacci level would be the best bet for an immediate U-turn. However, such a move would require support from the broader market.
Reasoning
Three lower peaks on the Awesome Oscillator suggested bullish weakening in the market. A surge of selling pressure usually follows after such readings. Such a trend was also observed on the Relative Strength Index since it threatened to move deeper into bearish territory.
Finally, the MACD continued to trade bearish and attracted more selling pressure.
Conclusion
A head and shoulders formation threatened a major sell-off in the DOT market. Traders can wait for DOT to close below the 38.2% Fibonacci level and then take up short positions.
Take-profits can be set at the 23.6% Fibonacci level. This would represent a 23% profit for short-sellers.


