Polkadot: What these signs indicate about DOT’s possible recovery

Disclaimer: The findings of the following analysis are the sole opinions of the writer and should not be considered investment advice.
The past month belonged to the sellers as they redefined the sentiment by steering the trend to their fancy. As a result, Polkadot (DOT) bulls could not gather enough power to overturn the 23.6% Fibonacci resistance. Meanwhile, the sellers caused a down-channel markdown on the daily timeframe.
As the current structure was conducive for bears, DOT could see a short-term pullback toward the $13-$14 range before a lift-off rally. At press time, DOT traded at $14.9.
DOT Daily Chart
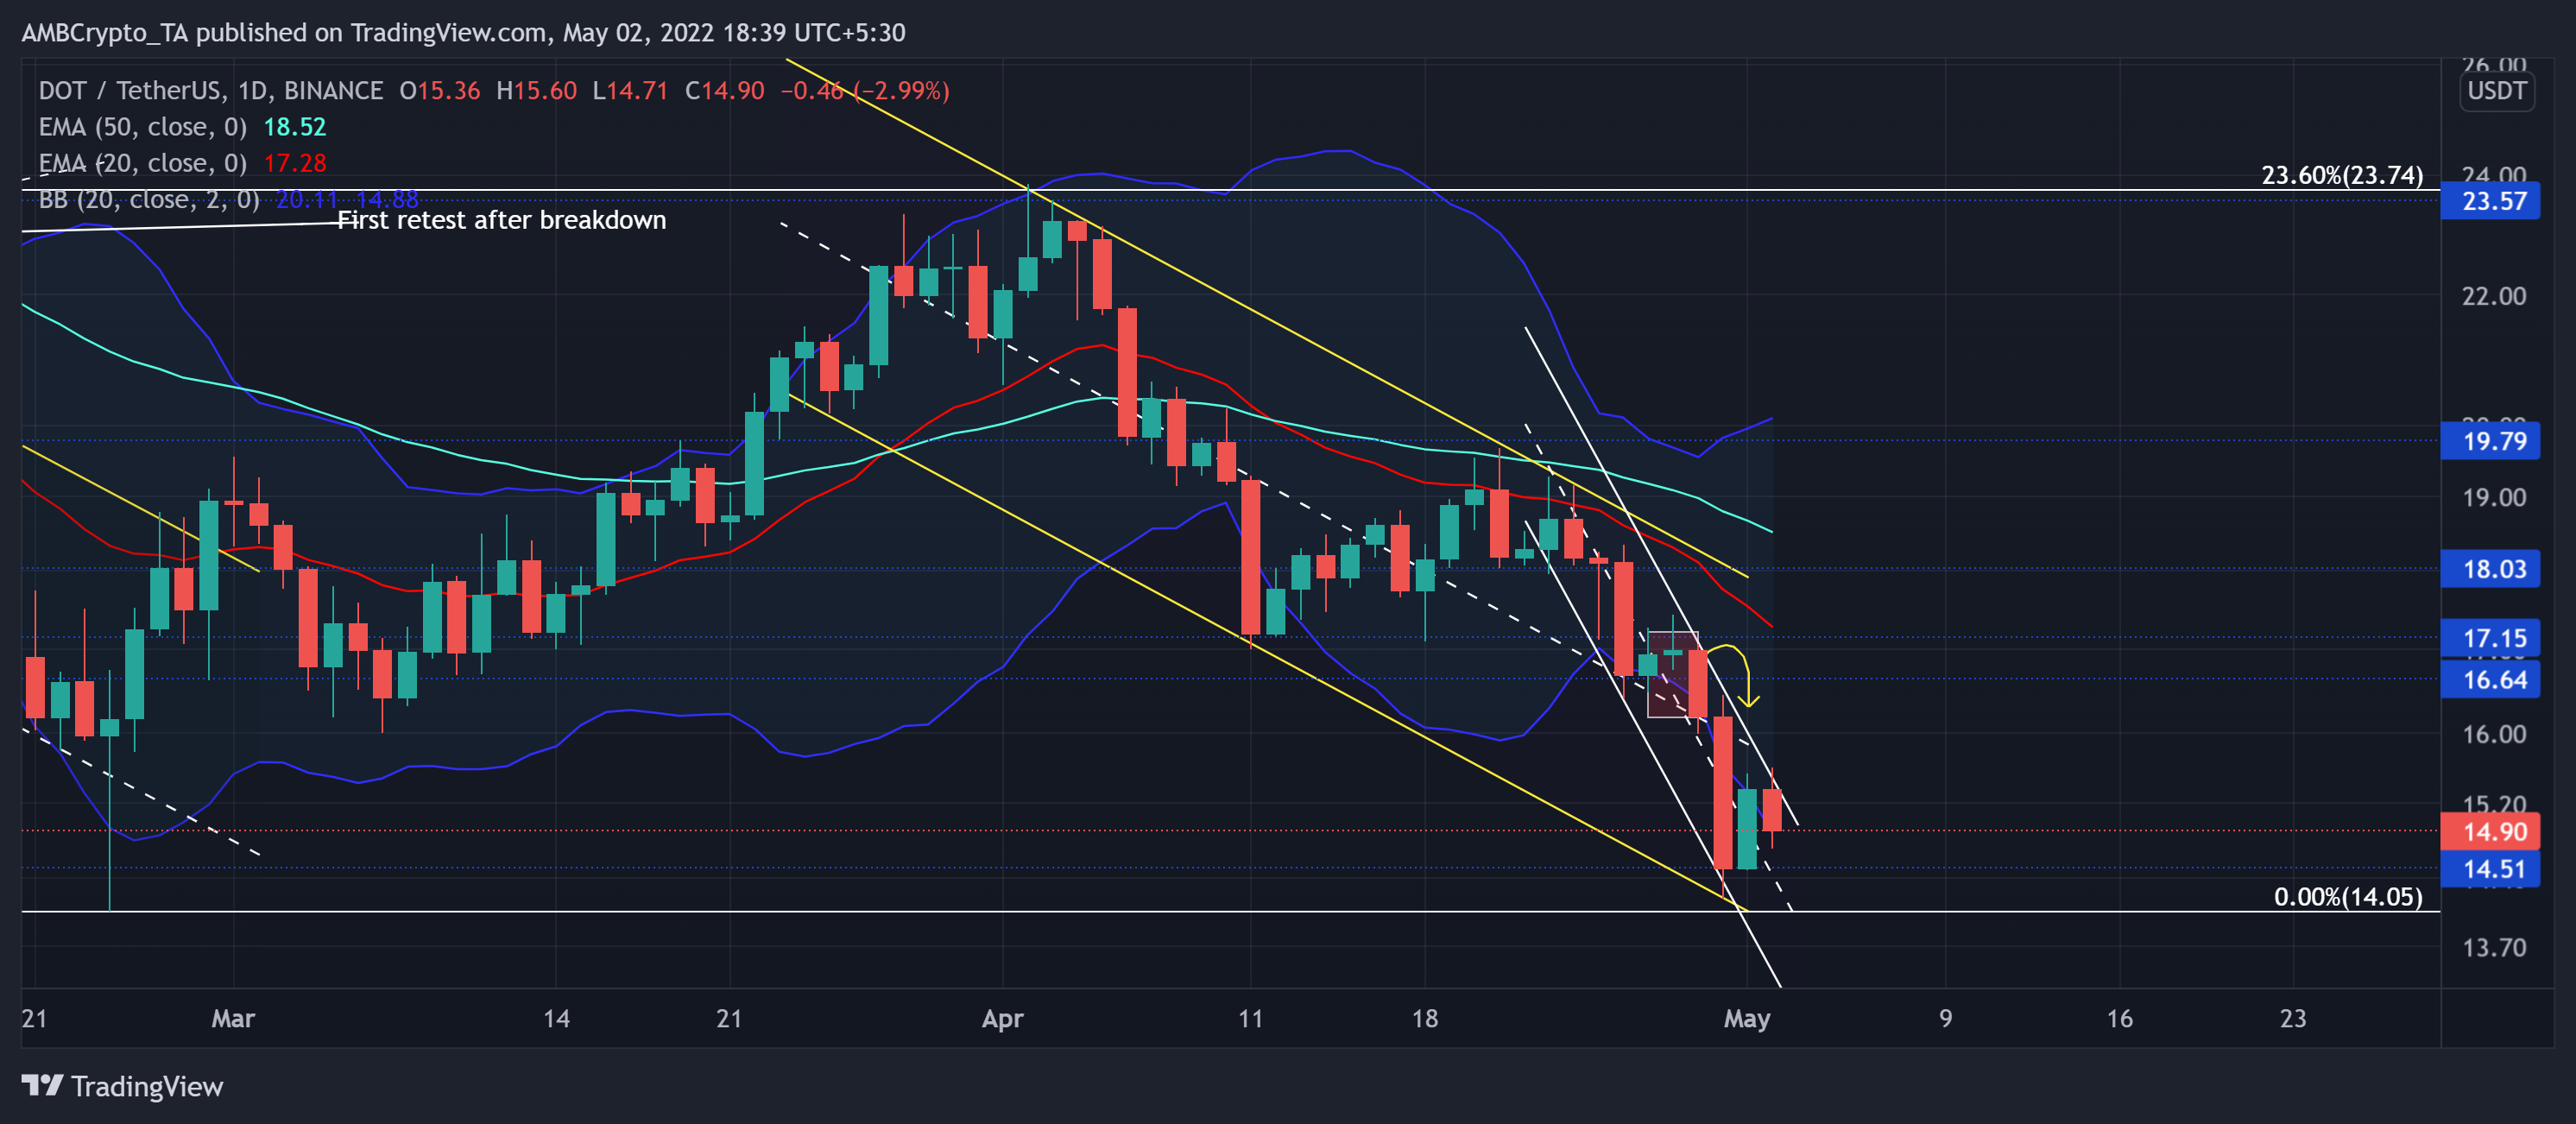
The extended bearish phase (from the 23.6% level) led the alt to lose more than 40.5% of its value in the last month and slip to its two-month low on 30 April. In this phase, the sellers undertook a strong recuperation while pushing DOT below the 20/50 EMA.
A closer look at the movements on its Bollinger Bands (BB) revealed the bearishness in the price over the last few weeks. The 20 EMA stood as a strong selling point for shunning bull recoveries. The current down-channel (white) oscillation alongside the rising gap between the 20 EMA and 50 EMA could justify bearish movements in the coming times.
The buyers have upheld the $14.5 baseline for over nine months now. Any close below this line could accelerate a fall to the lower trendline of the down-channel.
With the price approaching the lower band of the BB, the extended bearish pull should be able to find grounds in the $13-$14 range. A likely recovery from this range would help bulls test the 20 EMA near the $16-$17 zone in the days to come.
Rationale
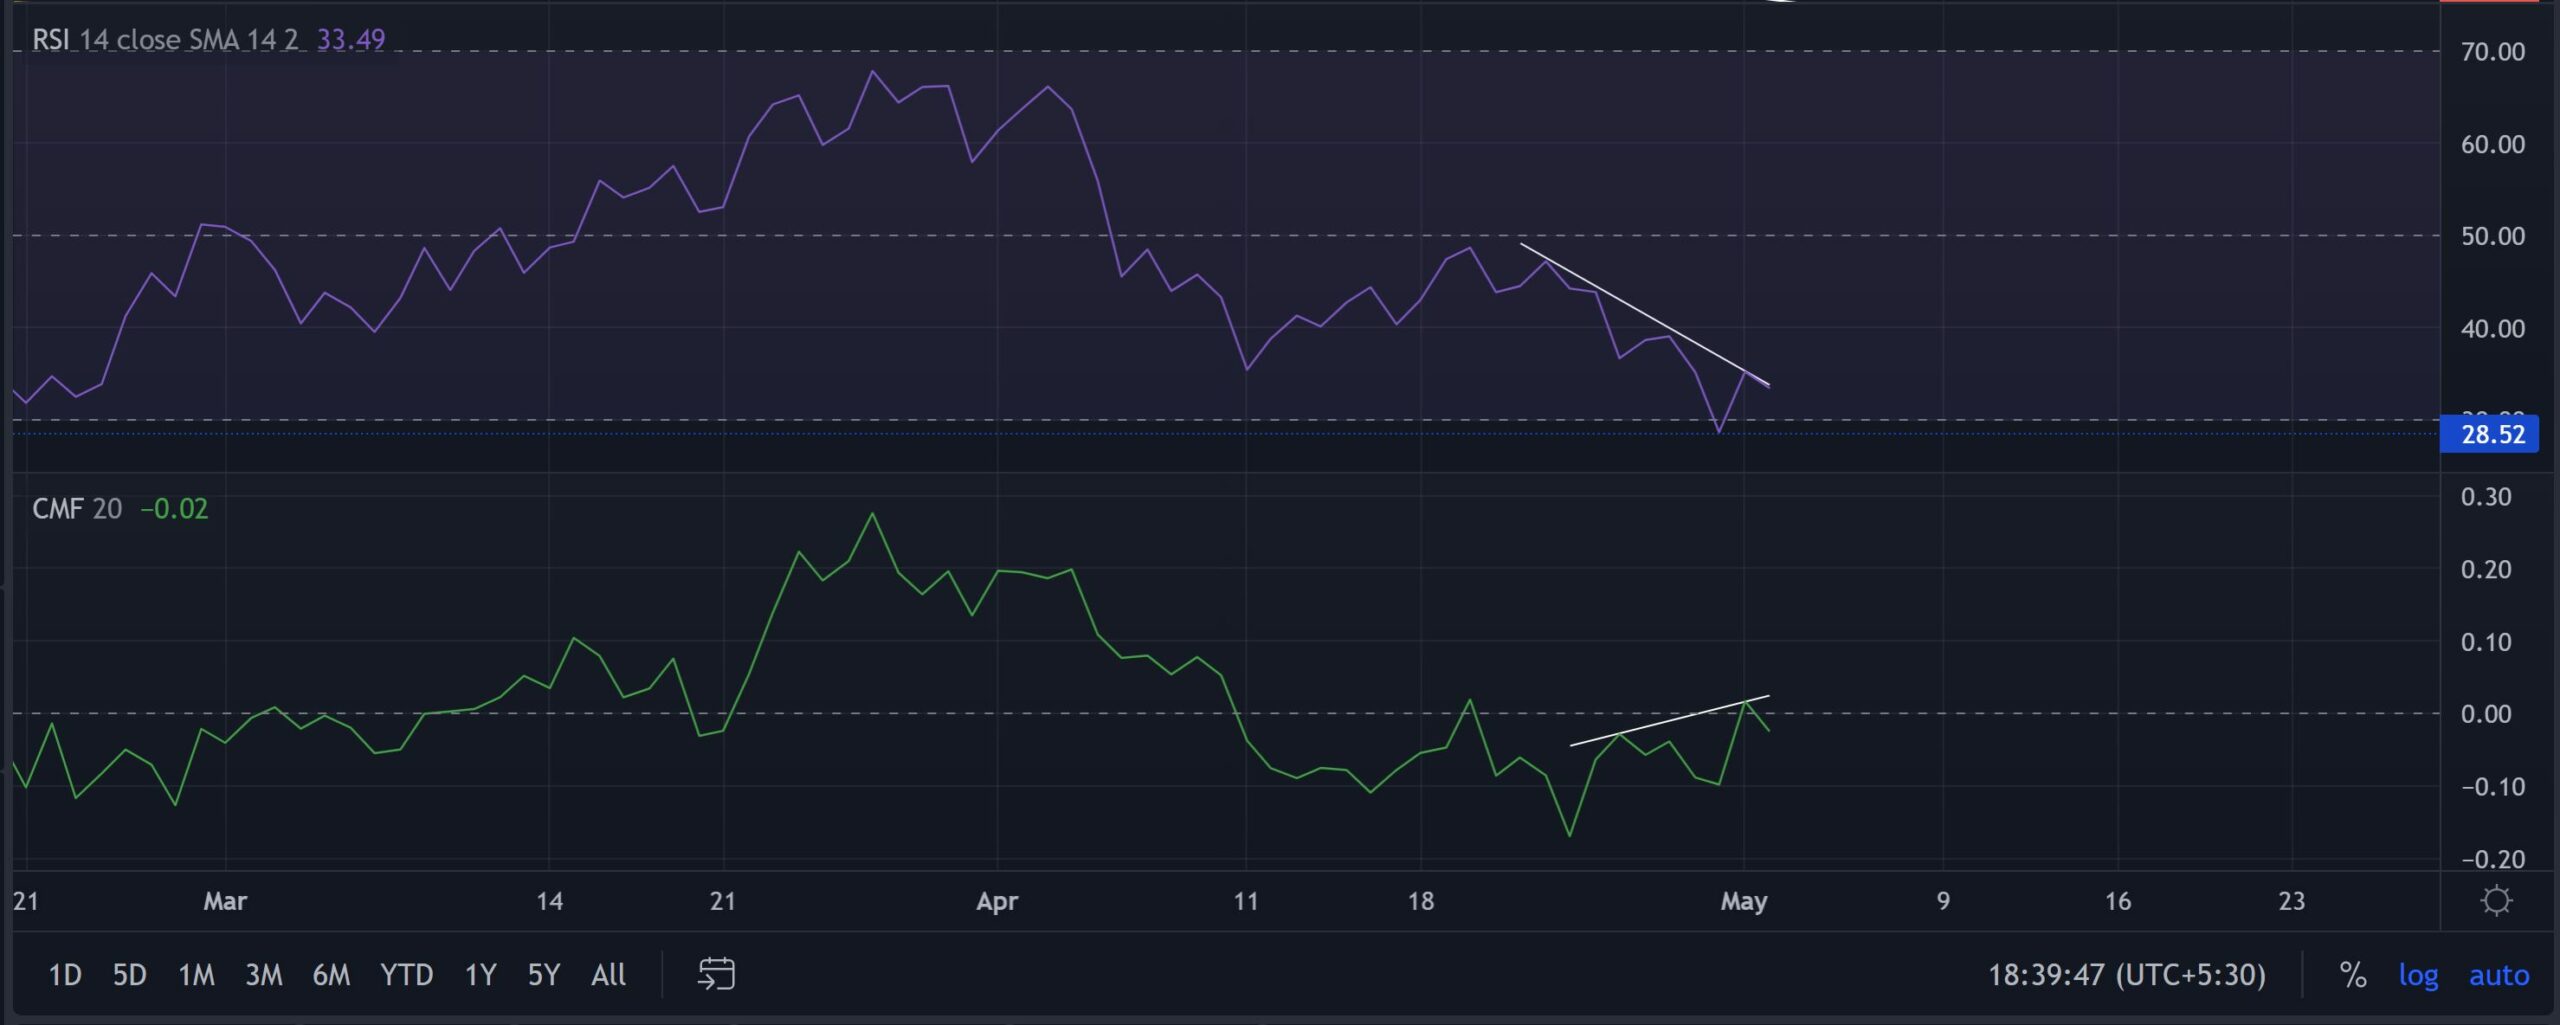
The RSI’s south-looking tendencies refrained from showing any improvements in the last few days. Whilst its trendline resistance stood stiff, the sellers boasted of their increasing edge. Any further retracements could make way for a bounce-back from the oversold mark.
The CMF further corresponded with the selling vigor after marking a hidden bearish divergence with price. Thus, it saw a retreat below the zero-mark.
Conclusion
The current sentiment could propel further price retracements in the short term. In which case, any further drop in the RSI could trigger a short-term recovery. To top it up, oversold readings on its BB could expose DOT to a rally toward the $16-region.
Ultimately, an overall market sentiment analysis becomes vital to complement the technical factors to make a profitable move.