Polkadot – Why it might be worth the risk if you’re a trader

The prices of most top altcoins have been rallying over the last couple of days, despite some corrections. In fact, the former pushed the cumulative altcoin market cap up by more than 15% in just one week.
Polkadot was one of the alts to profit, with a weekly ROI of +30.90% and price gains of around 25.32%. However, at the time of writing, DOT had fallen by 7% already. Thus, the real question at this time is this – Would these dips drag DOT down or will it find its northbound trajectory once again?
Polkadot – The spot market star
Irrespective of what went on with the alt’s price at the time of writing, the spot market underlined high enthusiasm for Polkadot. High-volume candlesticks for the alt, along with recent price gains, highlighted the presence of an active market.
In fact, a recent Kraken report found that DOT was the fourth-best performing mid-asset on the exchange last week, with its trade volumes up by 6.2%. This again is indicative of rising spot trading interest for the alt.

Mid-size trading asset; Source: Kraken
Despite corrections, is DOT still ticking?
A previous article highlighted how Polkadot’s circulating market cap has started making a V-shaped recovery. It is notable that even though the asset’s price saw a dip after 1 August, the circulating market cap kept going up – A good sign for the alt.
That being said, a look at the four-hour chart for DOT revealed that trade volumes are comparatively up, despite corrections. The $20 level is a crucial point for the alt as it acted as long-term support for most of May and June. Once that point is breached, the alt will be more likely to rally.
Further, the Relative Strength Index for the alt entered the neutral zone with a sharp downtick on 02 August. It’s worth noting though that at press time, the same had stabilized with a reading of 67.2.
Which cause do on-chain metrics support?
Most altcoin rallies can be hugely affected by external factors such as social sentiment.
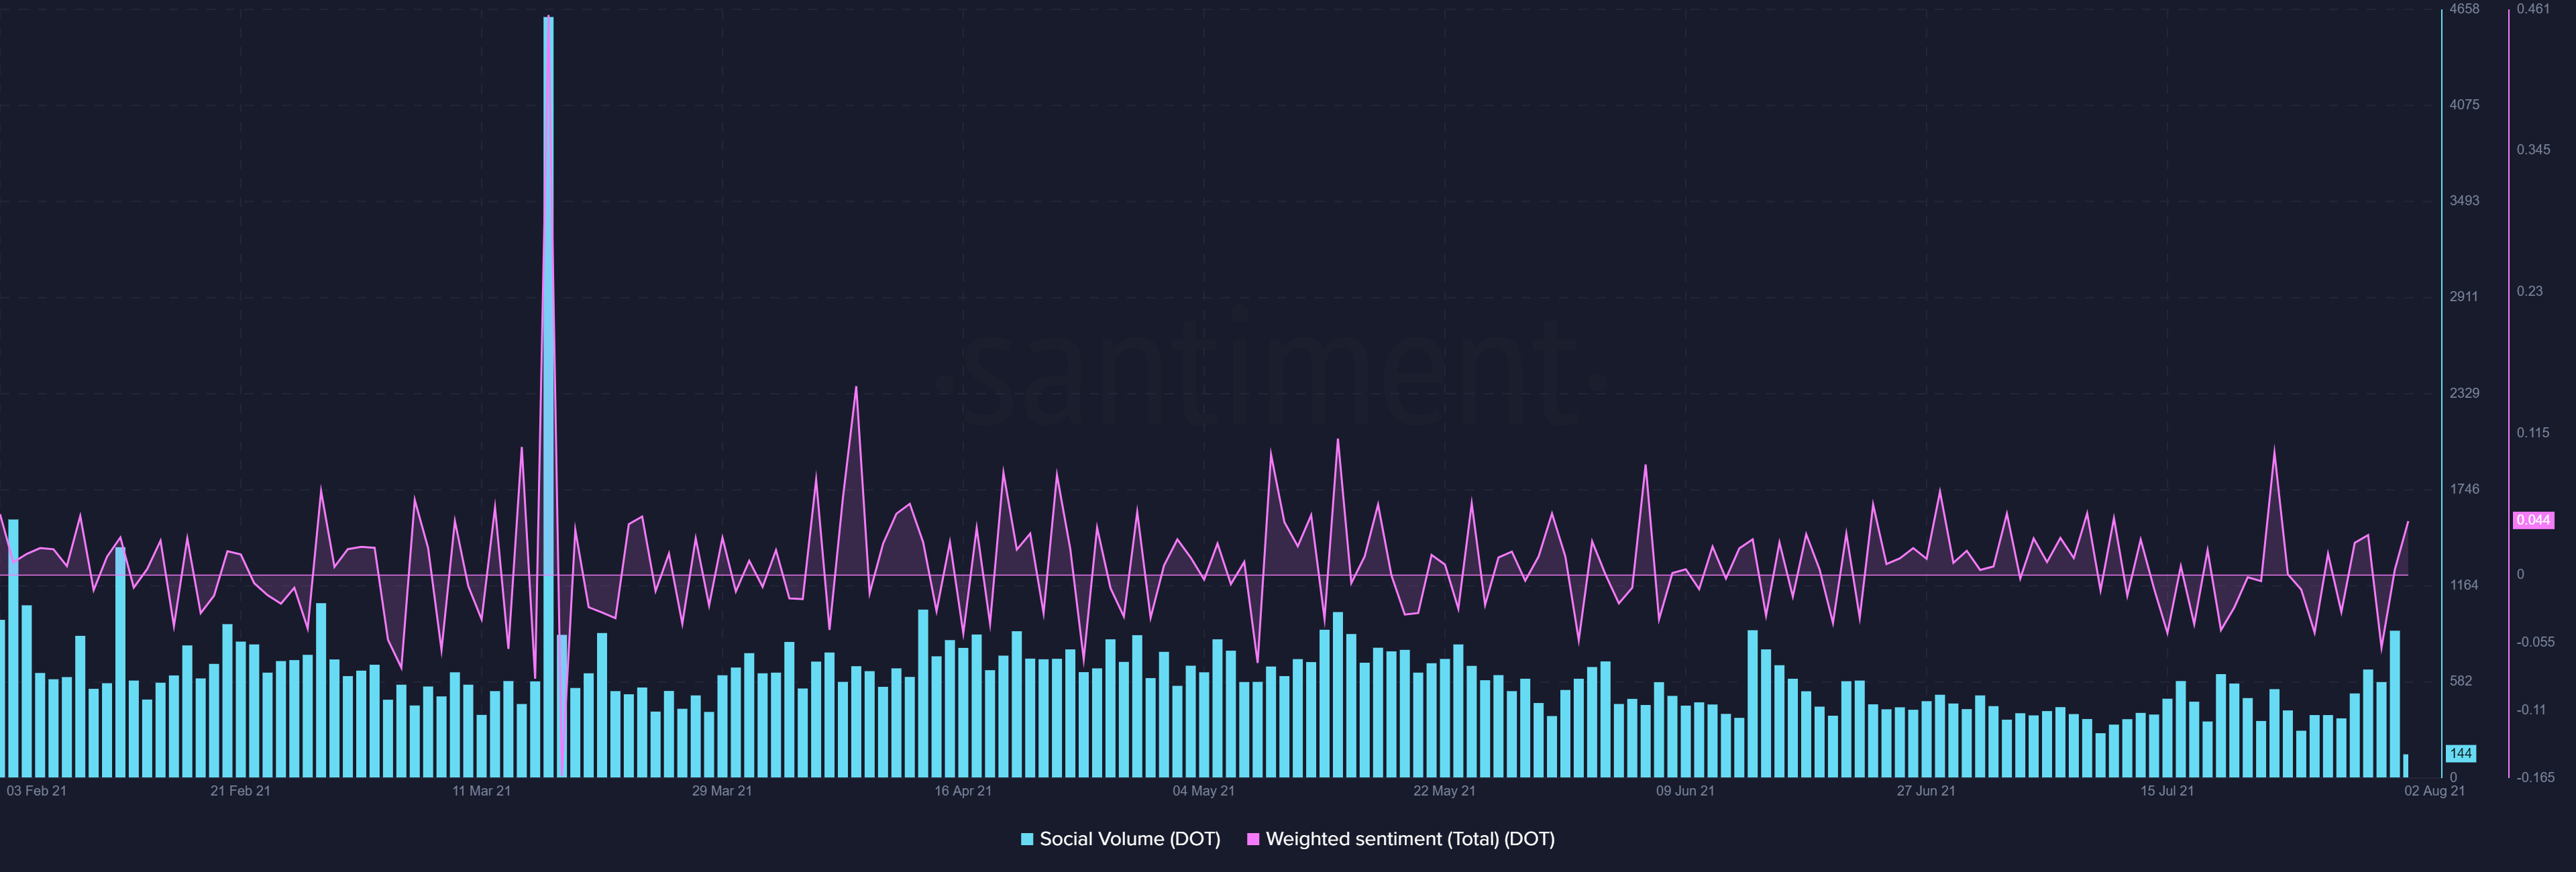
Polkadot seemed to be no different, with the same noting a notable uptick in social volumes, the largest in one month, on 1 August. DOT’s total weighted sentiment also pictured a surge.
Polkadot’s price has yielded some decent ROIs, with the alt’s monthly ROI found to be 17.46%, despite losses. While higher ROIs might often be associated with high-risk assets, however, Polkadot did well on this front too.
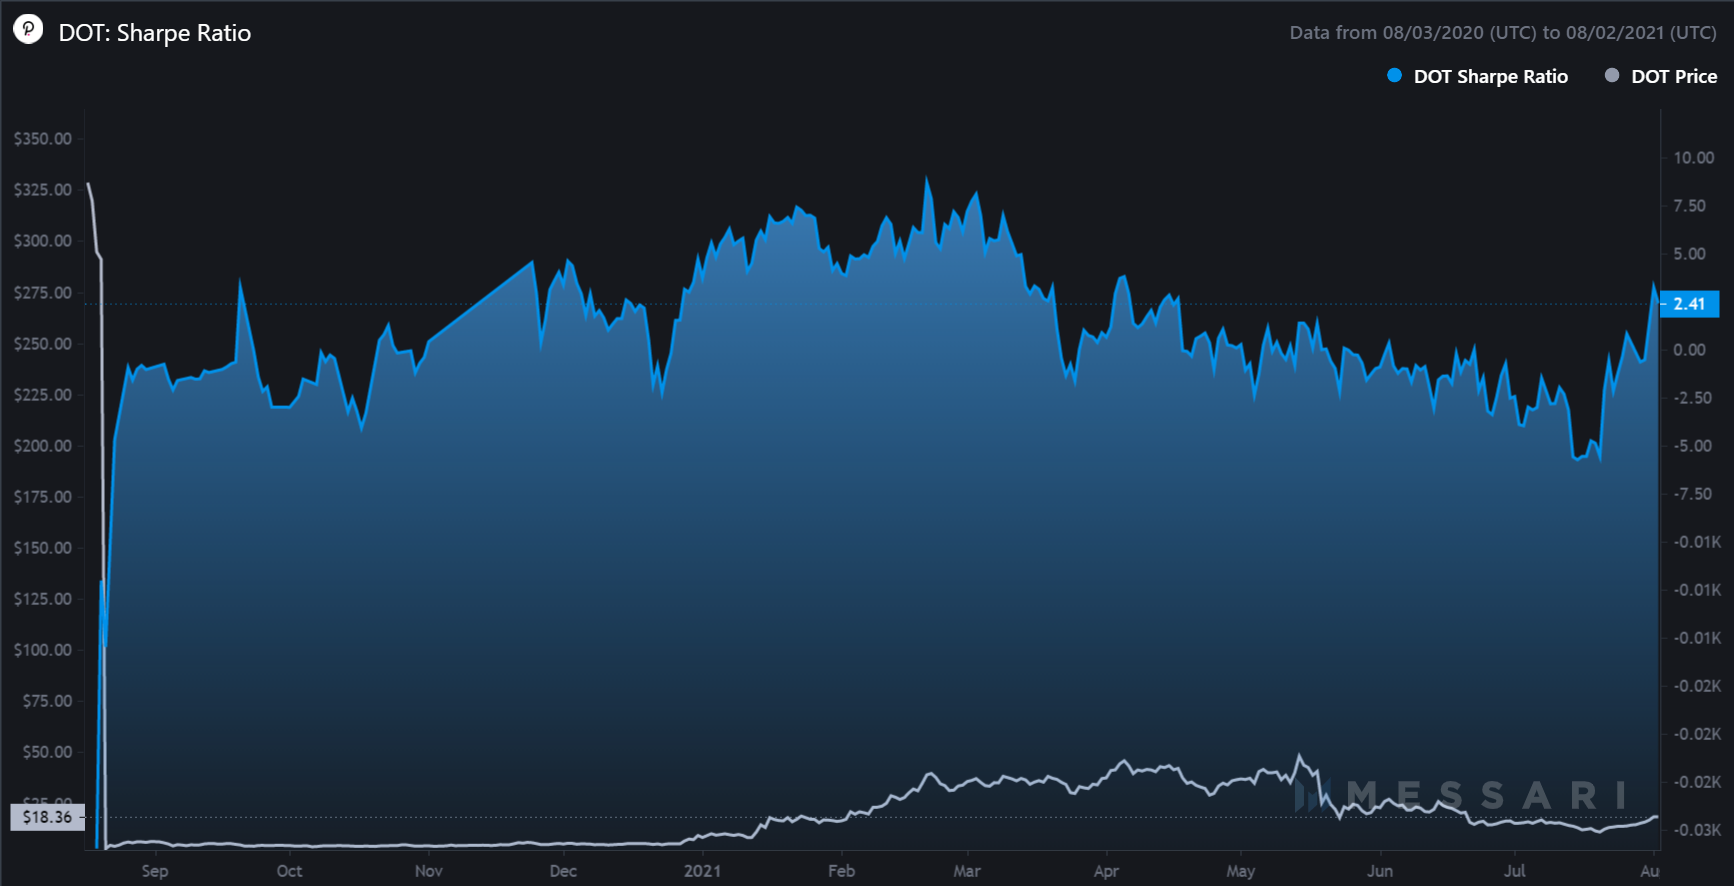
The Sharpe ratio, a metric that characterizes the performance of an asset compared to a “risk-free” asset over a certain period, also noted a major spike on DOT’s chart. In simpler terms, Polkadot is much more “risk-free” now than it was four months ago because the last peak in Sharpe Ratio was on 5 April.

Sharpe ratio – Source: Messari


