Polkadot’s [DOT] premature bull runs could see short-lived rally until…

Disclaimer: The findings of the following analysis are the sole opinions of the writer and should not be considered investment advice.
For nearly four months, the trendline resistance (yellow, dashed) has assumed a vital area of value. This resistance has ensured the alt’s steep southbound trajectory for over two months.
Also, the 20 EMA (red) has swiftly curtailed the buying efforts during this declining phase. So, a rebound from the 38.2% level can position the alt for a near-term setback on the chart. DOT needs to provoke a buying resurgence from the long-term support at $6.45 to prevent a major fallout.
At press time, DOT traded at $6.92, up by 8.13% in the last 24 hours.
DOT Daily Chart
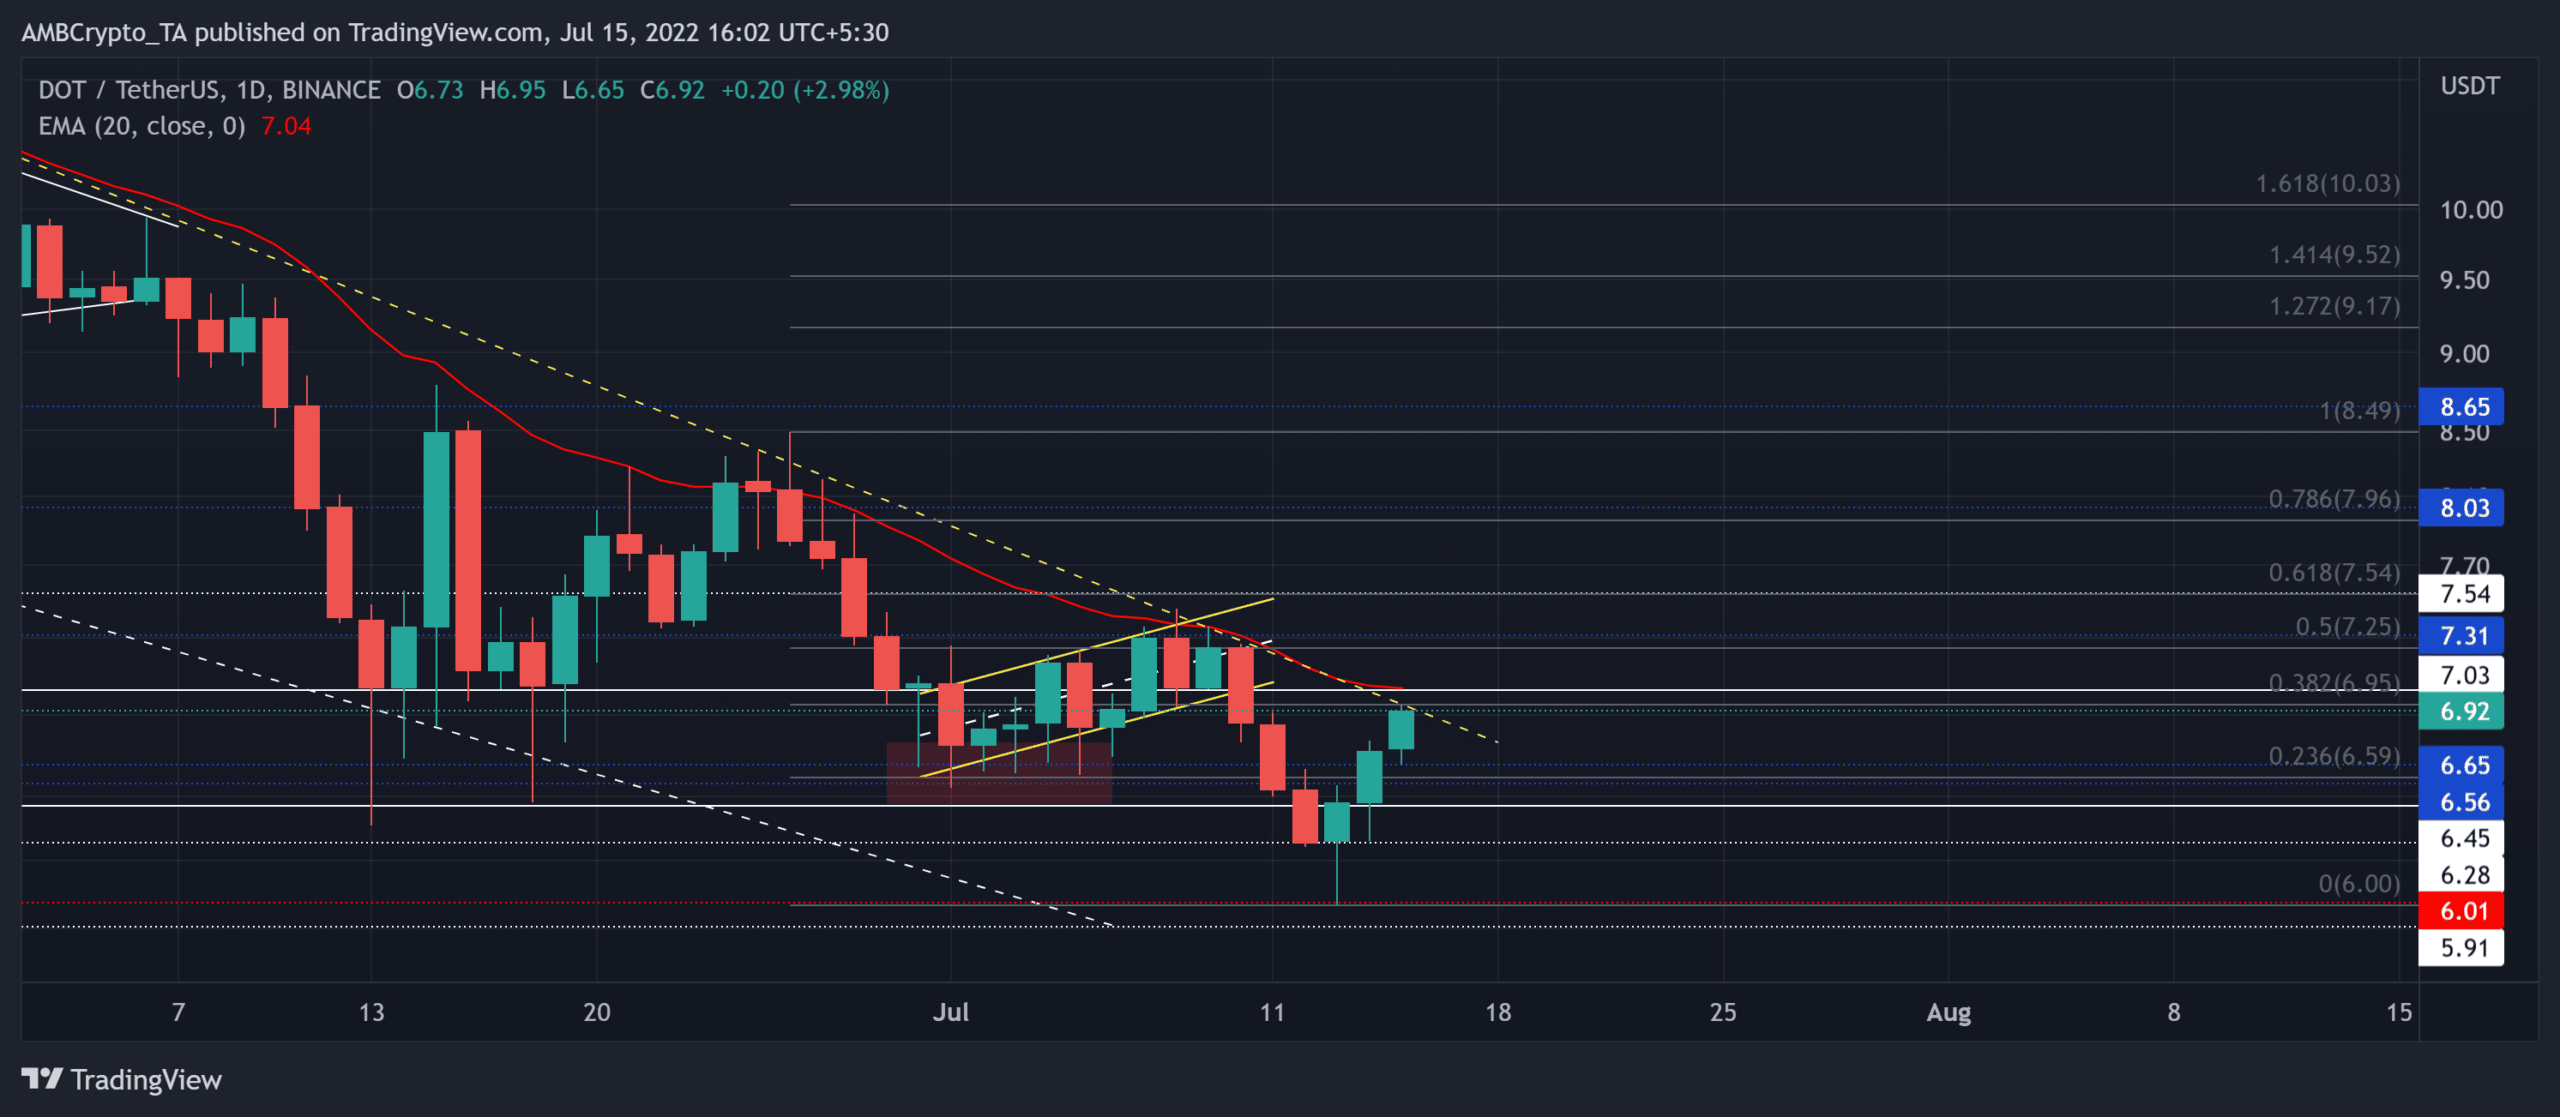
The ongoing sell-offs pulled DOT toward its 18-month low on 13 July after an over 44% 42-day decline. Post this, the buying pressure has kept the coin above its long-term support. But the trendline resistance and the 20 EMA have controlled the alt’s peaks.
DOT has been extending its compression phase. Should the current candlestick close below the 38.2% level, it would affirm the chances of a near-term decline on the chart.
Traders/investors should watch for a reversal from the $6.9 mark to confirm the increased chances of the coin’s historical tendency of dropping. In this case, the potential targets would lie near the $6.45-zone after a nearly 10% downside risk. Any bearish invalidations or premature bull runs could see a short-lived rally until the $7.3-zone.
Rationale
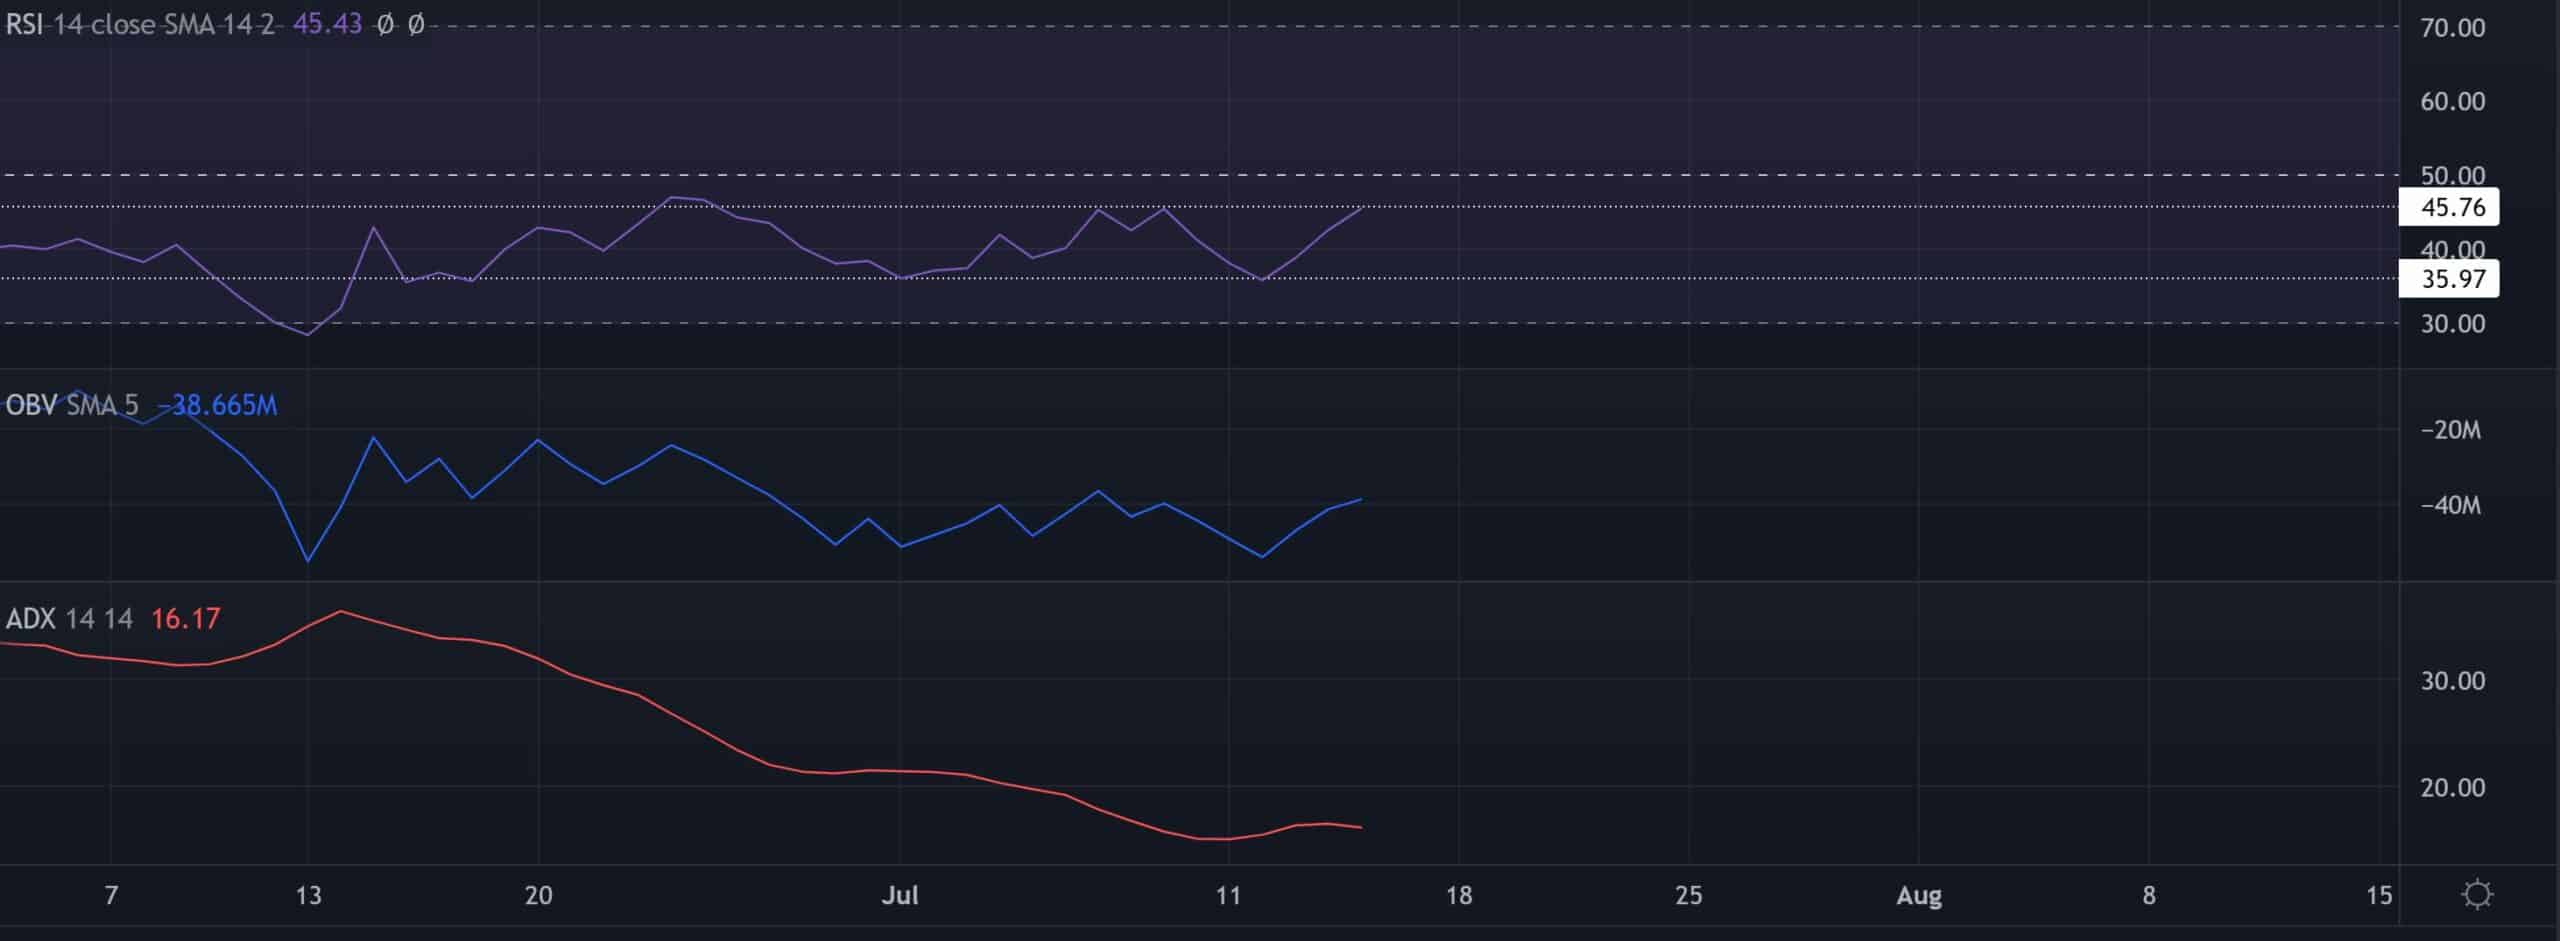
After attempting to escape its sideways track for nearly a month, the bulls have been struggling to breach the 45-mark. To alter the bearish narrative, the buyers still had to find a position above the midline.
Despite the price action’s lower peaks, the OBV refused to peak lower. Thus, revealing a mild bearish divergence with price over the last few days. Nevertheless, the ADX displayed a substantially weak directional trend for the alt.
Conclusion
In view of the confluence of the 38.2% level and the 20 EMA alongside the trendline resistance, DOT could continue on its bearish track. The targets would remain the same as discussed above.
Finally, an overall market sentiment analysis becomes vital to complement the technical factors to make a profitable move.


