Polkadot’s falling wedge: What August has in store for DOT traders
DOT might be an ideal candidate if you are a trader looking for an oversold cryptocurrency that has a lot of upside potential and here's why.

- Polkadot bears have dominated this year but the bulls may soon have a chance to shift the outcome.
- Demand remains low but Polkadot’s DeFi hub TVL growth signals long-term optimism.
The Polkadot [DOT] blockchain’s native cryptocurrency DOT has been a honeypot for the bears in 2024. It has delivered an overall downtrend despite kicking off the year with strong bullish momentum.
Recent observations suggest that the tables are about to turn for DOT.
DOT long-term price action traded within a falling wedge pattern that kicked off from its mid-March highs. It has achieved lower lows since December 2023.
An interaction with its descending resistance line towards the tail end of July triggered another wave of sell pressure. Its $5.37 press time price was just a 7% dip from retesting its next support level.
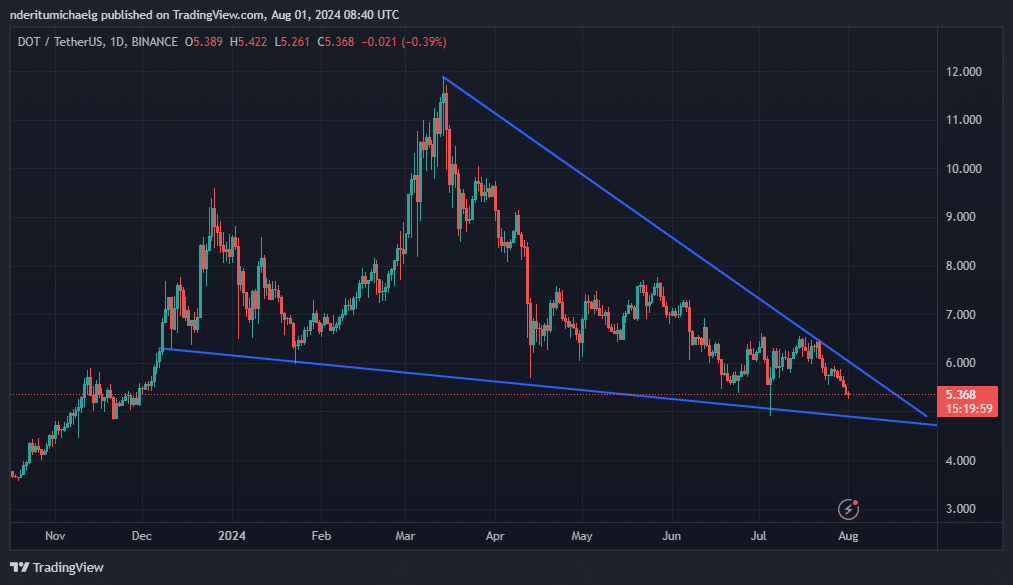
DOT’s falling wedge pattern revealed that the price is currently in a squeeze zone where accumulation is likely to take place. But will this lead to a breakout?
Assessing DOT bullish breakout possibility
Zooming out on DOT’s chart revealed that the price within a historic accumulation zone. Meanwhile, the wedge pattern underscored a higher probability of a pattern break.
The fact that the price was significantly discounted in the last few months also added to the bullish probability. Therefore, many traders might view its latest extended discount, as an attractive entry point.
The current trajectory suggests that DOT traders should anticipate strong support within the $4.9 price level if the downside continues. However, that does not necessarily indicate that the price may not dip lower.
Will the bulls recover any time soon? Based on our assessment, demand was severely lacking in the last week of July. This was evident by the price free fall observed during the same period.
The DOT open interest heatmap collaborated the same observation. DOT open interest remained cool since 24 thJuly.
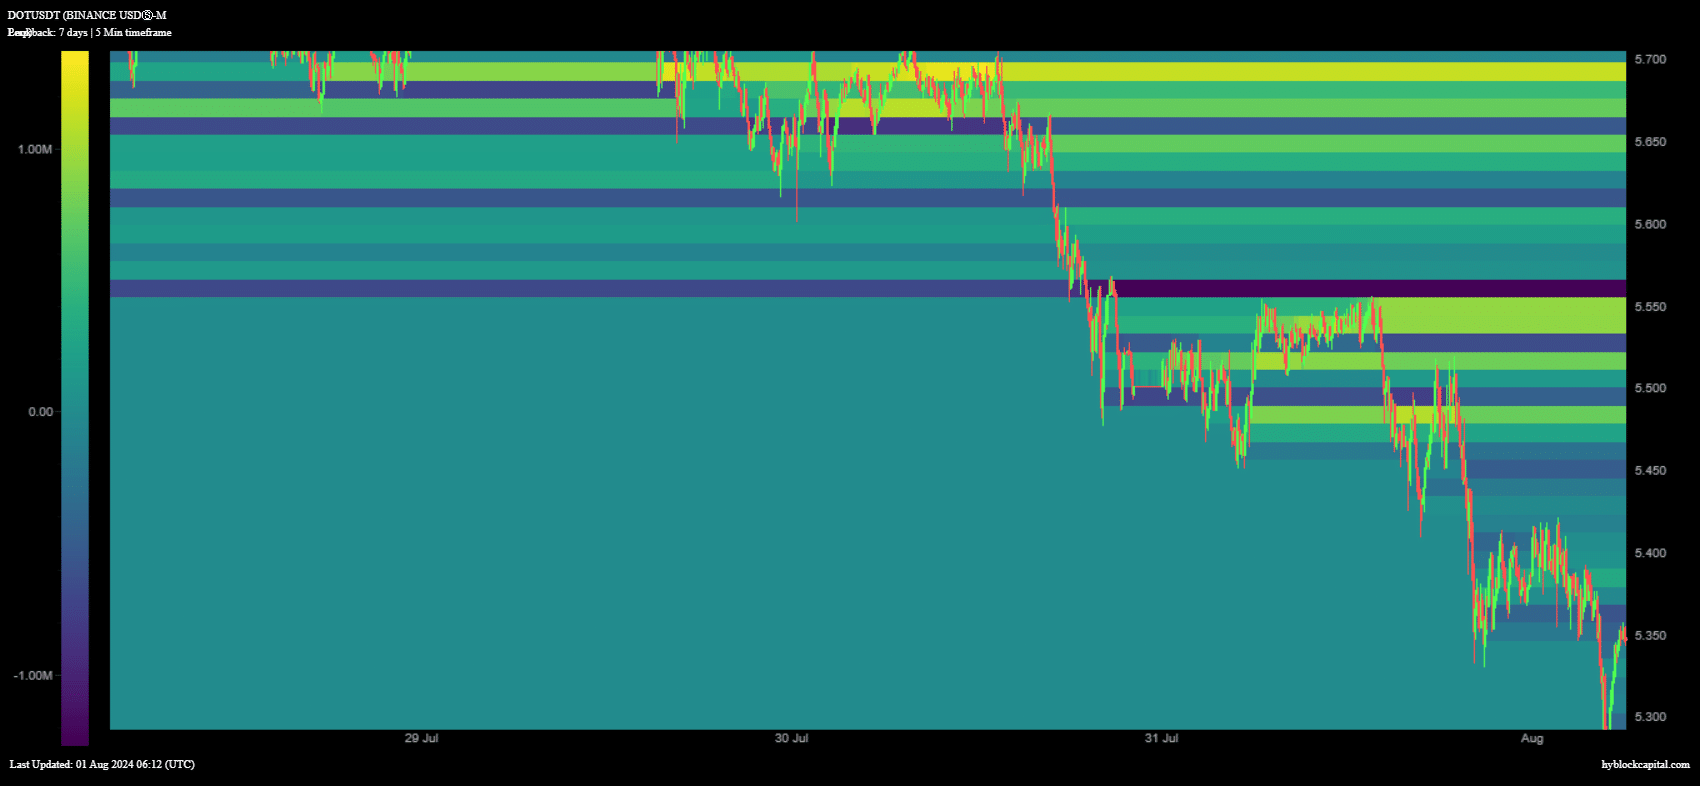
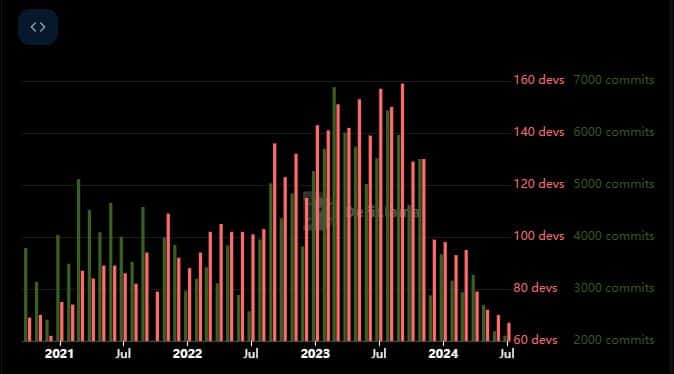
DOT was close to a historic demand zone at the time observation. We will observe this zone to identify signs that may indicate accumulation. Nevertheless, the declining price might signal that investors have been losing confidence in the project. This was further collaborated by the decline in developer activity.
It was not all negative news though. Hydration, Polkadot’s decentralized finance recently offered some optimism.
Read Polkadot [DOT] Price Prediction 2024-2025
The platform, previously know as HydraDX has been growing. Its TVL soared to an ATH in July after delivering explosive growth since the start of 2024.
Hydration’s impressive Omnipool TVL growth may signal that long-term holders are staking their DOT. Perhaps a sign that long-term DOT holders remain optimistic.


