Polkadot’s short-term bullish outlook might depend on these key levels

Disclaimer: The findings of the following analysis are the sole opinions of the writer and should not be considered investment advice
Bitcoin and most of the large and medium cap altcoins tumbled last week as news of a Russian invasion emerged and global markets reacted with fear. However, over the past few days, the price has hauled itself back above some important near-term levels.
Polkadot also saw some demand arrive in the past few days after dropping below the $15-mark recently.
DOT- 2 hour chart
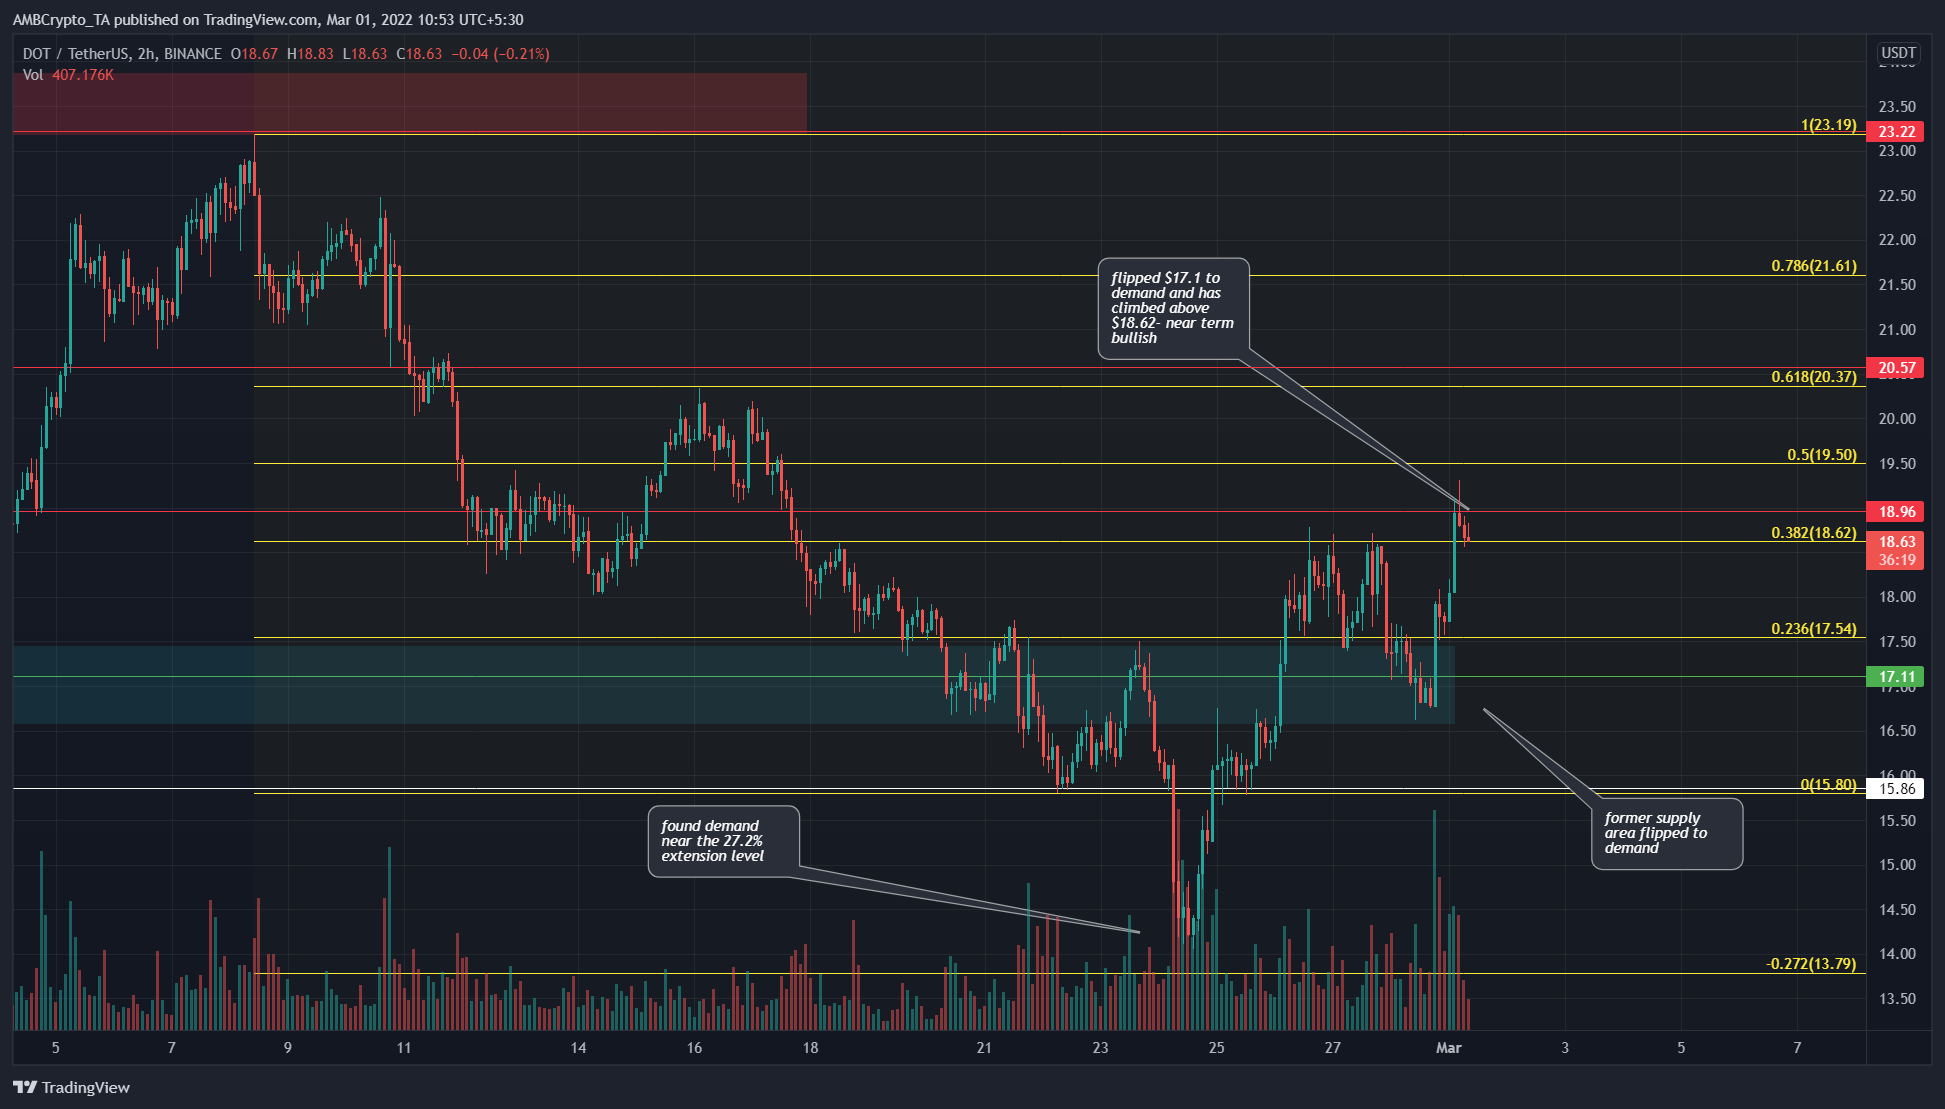
A set of Fibonacci retracement levels (yellow) were plotted based on DOT’s move from $23.19 to $15.8. It presented the $13.79-level as a place where bulls could potentially enter the fray. DOT didn’t quite reach these lows but halted at $14.2 before seeing a bounce.
At the time of writing, the market structure was near-term bullish. This was because the price had climbed above the $17.1 (cyan box) area and retested it to find demand. Moreover, the $18.6 area acted as supply on the hourly timeframe over the past two weeks. However, the price pierced above this level in recent hours as well.
Therefore, a move upward can be expected in the next few days, targeting $20.5 and $23.2. Before that, a pullback to $18 or $17.5 could occur and would be a buying opportunity.
Rationale
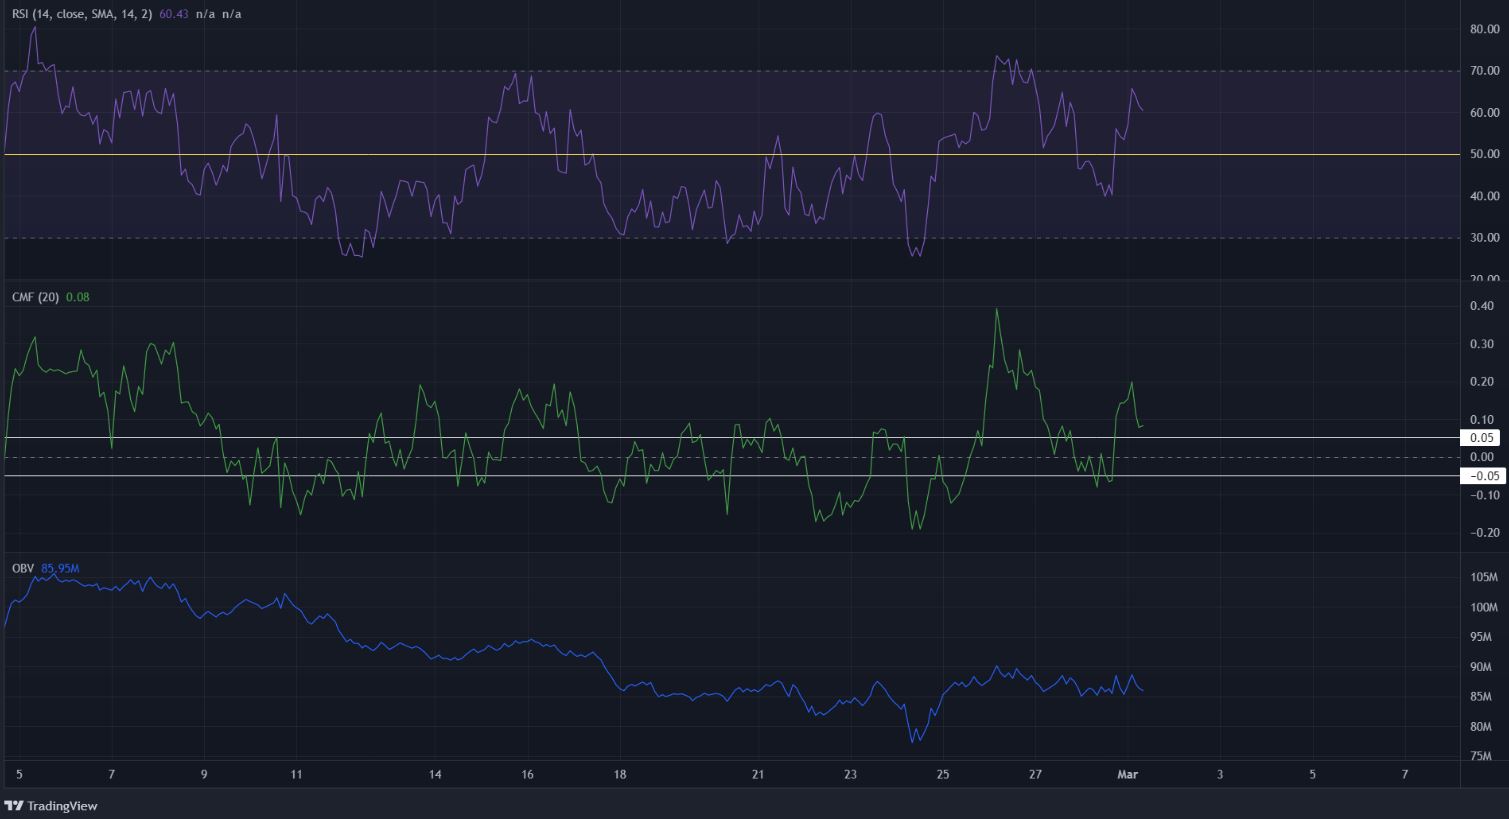
The RSI stayed above neutral 50 in the past few hours to show that bullish momentum remained strong. The Chaikin Money Flow also stayed above +0.05 to indicate significant capital flow into the market.
The OBV had been on a steady downtrend over the past few weeks. However, over the past five days, the OBV has seen a bounce, registering a higher low to signal buying volume.
Conclusion
The $17.2 area was flipped to demand and the price saw an hourly session close above $18.62 as well. A pullback to $17.5-$18 area, if seen, would likely be followed by another leg upward for Polkadot.


