Polygon: MATIC could see some losses in coming days, answering why

Disclaimer: The information presented does not constitute financial, investment, trading, or other types of advice and is solely the writer’s opinion.
- The market structure was on the verge of flipping to bullish on the 4-hour timeframe.
- The two resistance zones north of MATIC could see the token form a range in the coming days.
Polygon saw a drop in network fees and revenue in recent weeks, even though the daily active addresses had increased by a small margin. The report highlighted a downturn in the weighted sentiment also.
Read Polygon’s [MATIC] Price Prediction 2023-24
Ethereum led the rally for altcoins on the lower timeframes but MATIC was stuck just beneath a level that has acted as resistance for most of March. A Bitcoin breakout past $29.2k could see MATIC punch through this resistance.
The support around the $1.05 level saw some buying pressure in the past week
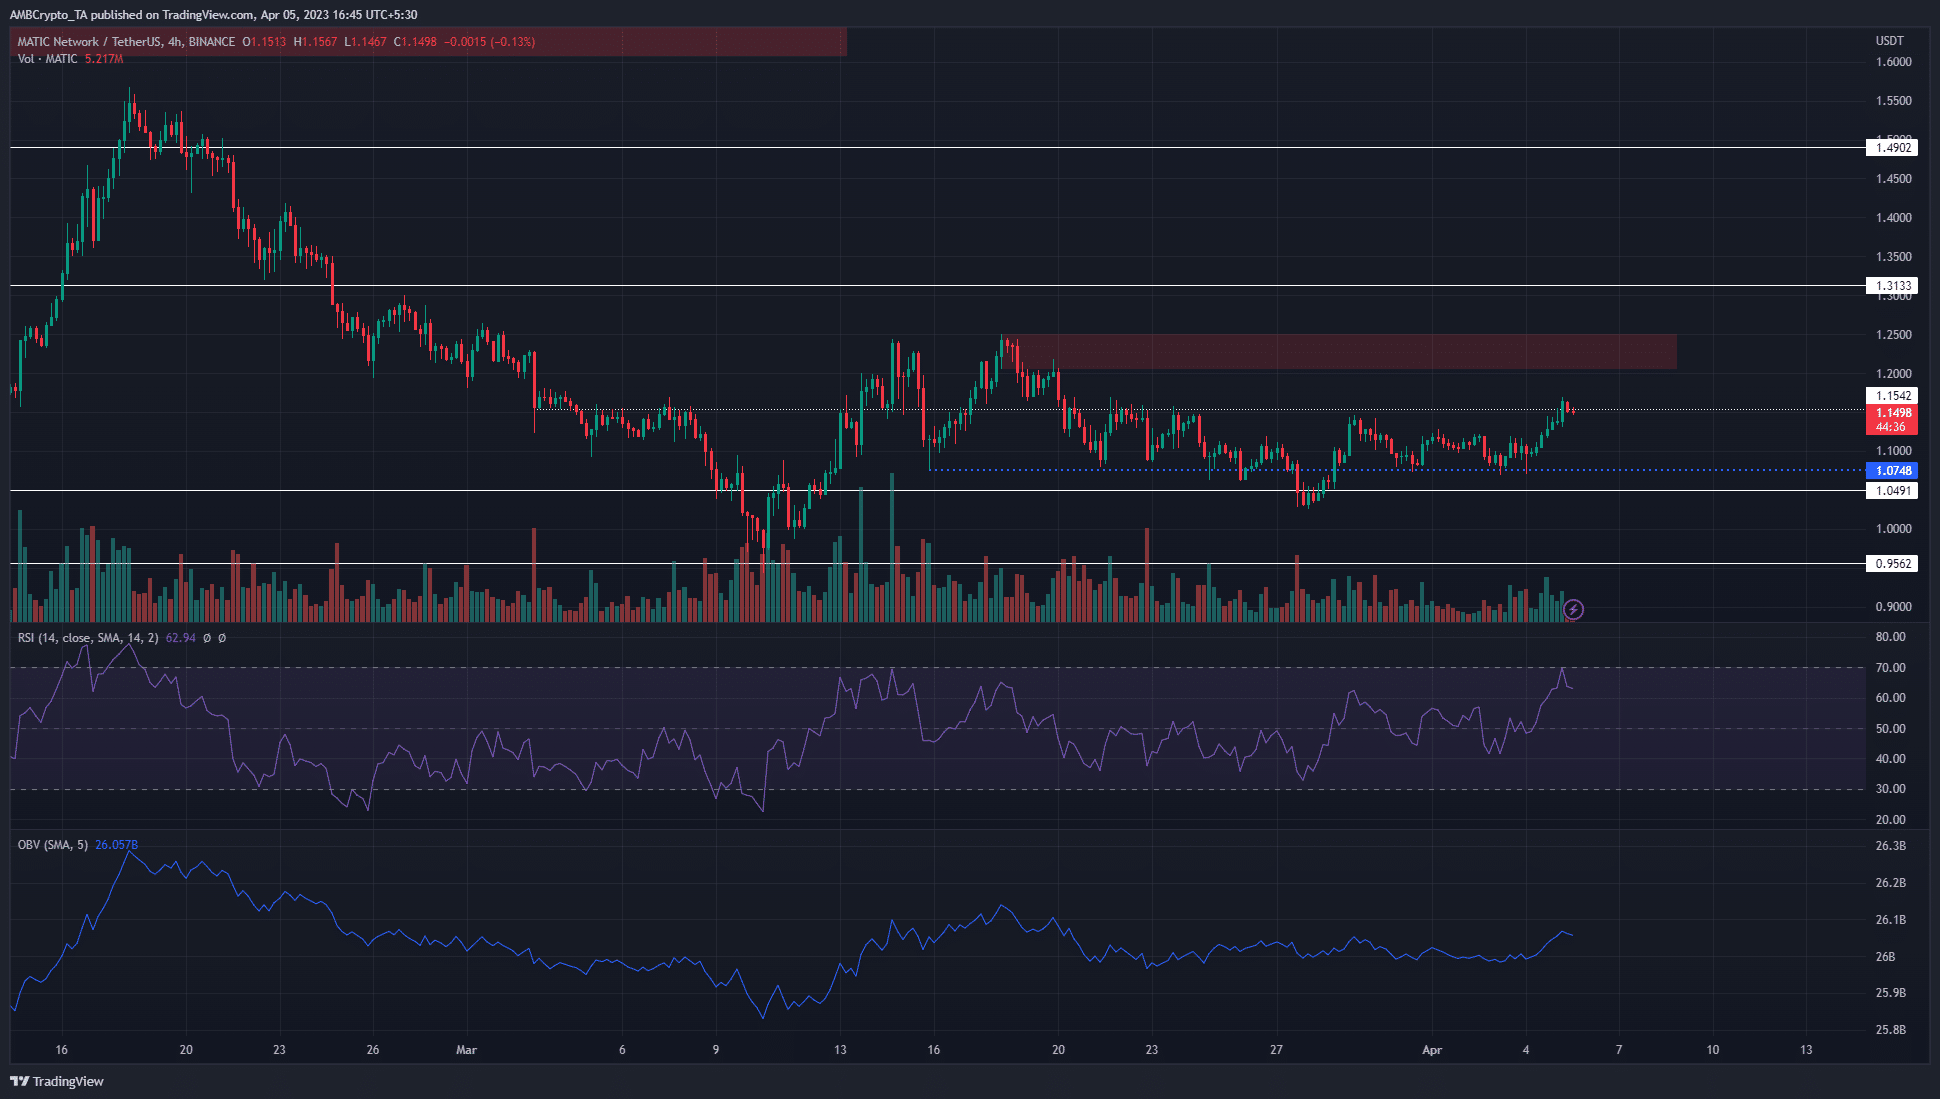
MATIC has formed a series of lower highs since mid-March when it formed a double top at the $1.25 level before sliding beneath the $1.15 mark. During this descent, MATIC fell beneath the $1.07 higher low and flipped the structure to bearish.
Since then, the bulls have not been able to push the price above $1.15 convincingly. At the time of writing, MATIC traded at $1.1498, and an upwards move could materialize in the coming hours. This was supported by the rising RSI, which showed strong bullish momentum in April.
Is your portfolio green? Check the Polygon Profit Calculator
Another interesting fact for the bulls was that, in the past two weeks, each retest of the $1-$1.05 area saw the OBV climb slightly higher. On 4 April the OBV shot upward after the latest retest of the same support zone, which highlighted noticeable demand behind MATIC’s rally.
The futures market suggested the outlook might not be as rosy for the bulls
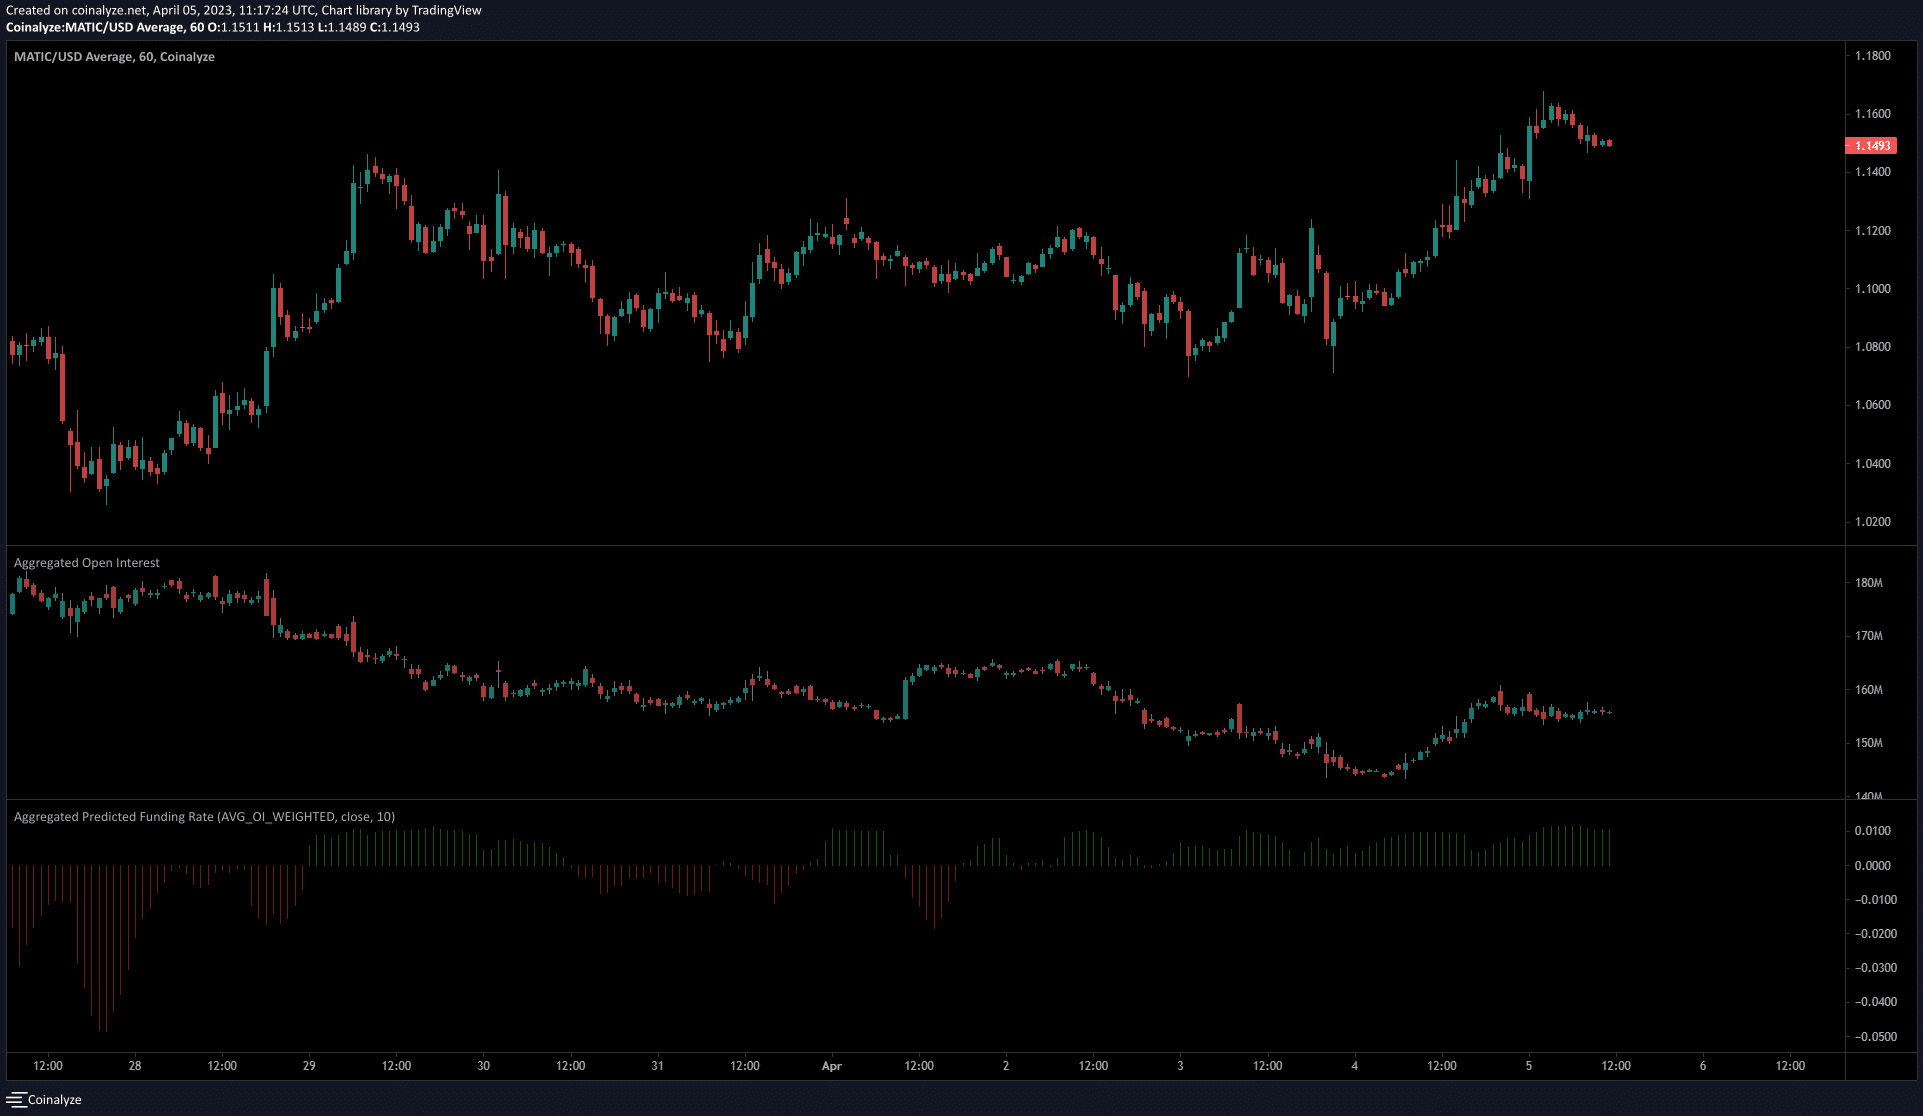
The predicted funding rate was positive, according to Coinalyze data, which agreed with the bullish thesis from the price action chart. Yet, the Open Interest has been in a downtrend since 28 April.
Even the MATIC rally from $1.07 to $1.14 did not see the OI form a higher high, although it did move upward in recent hours before tapering off.
This indicated a lack of strong bullish sentiment from futures market participants. Therefore, the possibility of a rejection at $1.15 or $1.25 remained likely.
This could see the native token of Polygon establish a range between $1.05-$1.15 or $1.25, depending on where the rejection might occur (if it occurred).