Post-halving, Bitcoin hits this record – but how long will it last?
The increase in Bitcoin's fee shows how miners can still make money from increased activity despite the halving.
- Bitcoin posted strong fees post-halving.
- BTC remained in a bear trend despite an over 1.7% increase.
The Bitcoin [BTC] halving, anticipated to lower miner fees, has occurred. Contrary to expectations, fees hit a record high post-halving. However, indications suggest it might be temporary.
Bitcoin records highest average transaction fee
The Bitcoin halving took place in the early hours of Saturday, the 20th of April. However, by the end of that day, network fees had soared to a record high, contrary to expectations from the halving.
Analysis from Glassnode revealed that on the 20th of April, fees spiked to over 1,257 BTC, equivalent to over $81 million at the time.
This marked the highest daily fee recorded in years, a significant increase for the platform and its miners.
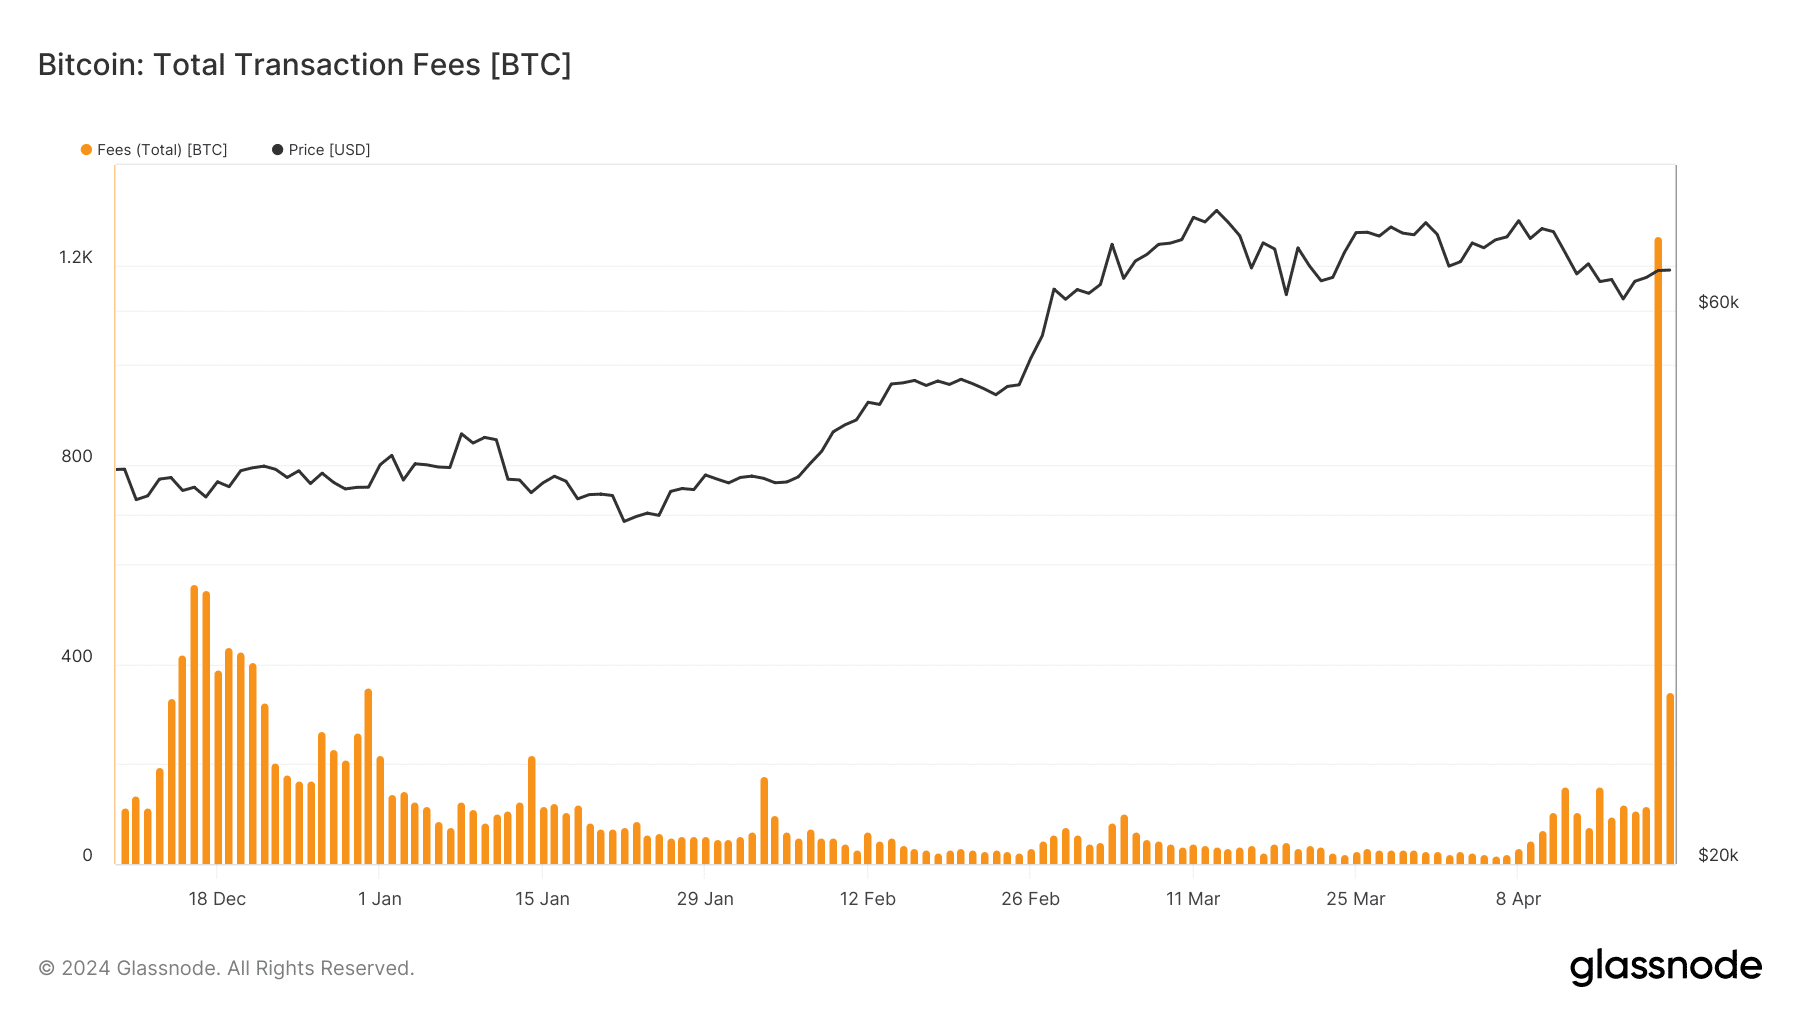
Further examination of the average fees paid on the network indicated an increase to approximately $128 per transaction on the 20th of April.
Also, looking at the fee chart on Crypto Fees, Bitcoin exhibited the highest fees in the past seven days. The average fee was over $20.2 million, compared to Ethereum’s [ETH] closest average of almost $5 million.
However, as of the time of writing, daily fees had declined. According to Glassnode, fees dropped to 344 BTC, equivalent to around $22.3 million.
This substantial fluctuation in fees coincided with a decrease in the number of daily new users.
Bitcoin addresses fall to lowest in over a year
While fees were reaching record highs, the number of daily new Bitcoin addresses was moving in the opposite direction.
AMBCrypto’s analysis of Glassnode revealed a notable decrease in address creation. As of press time, the number stood at 259,431, a drop from the 300-400,000 range seen days earlier.
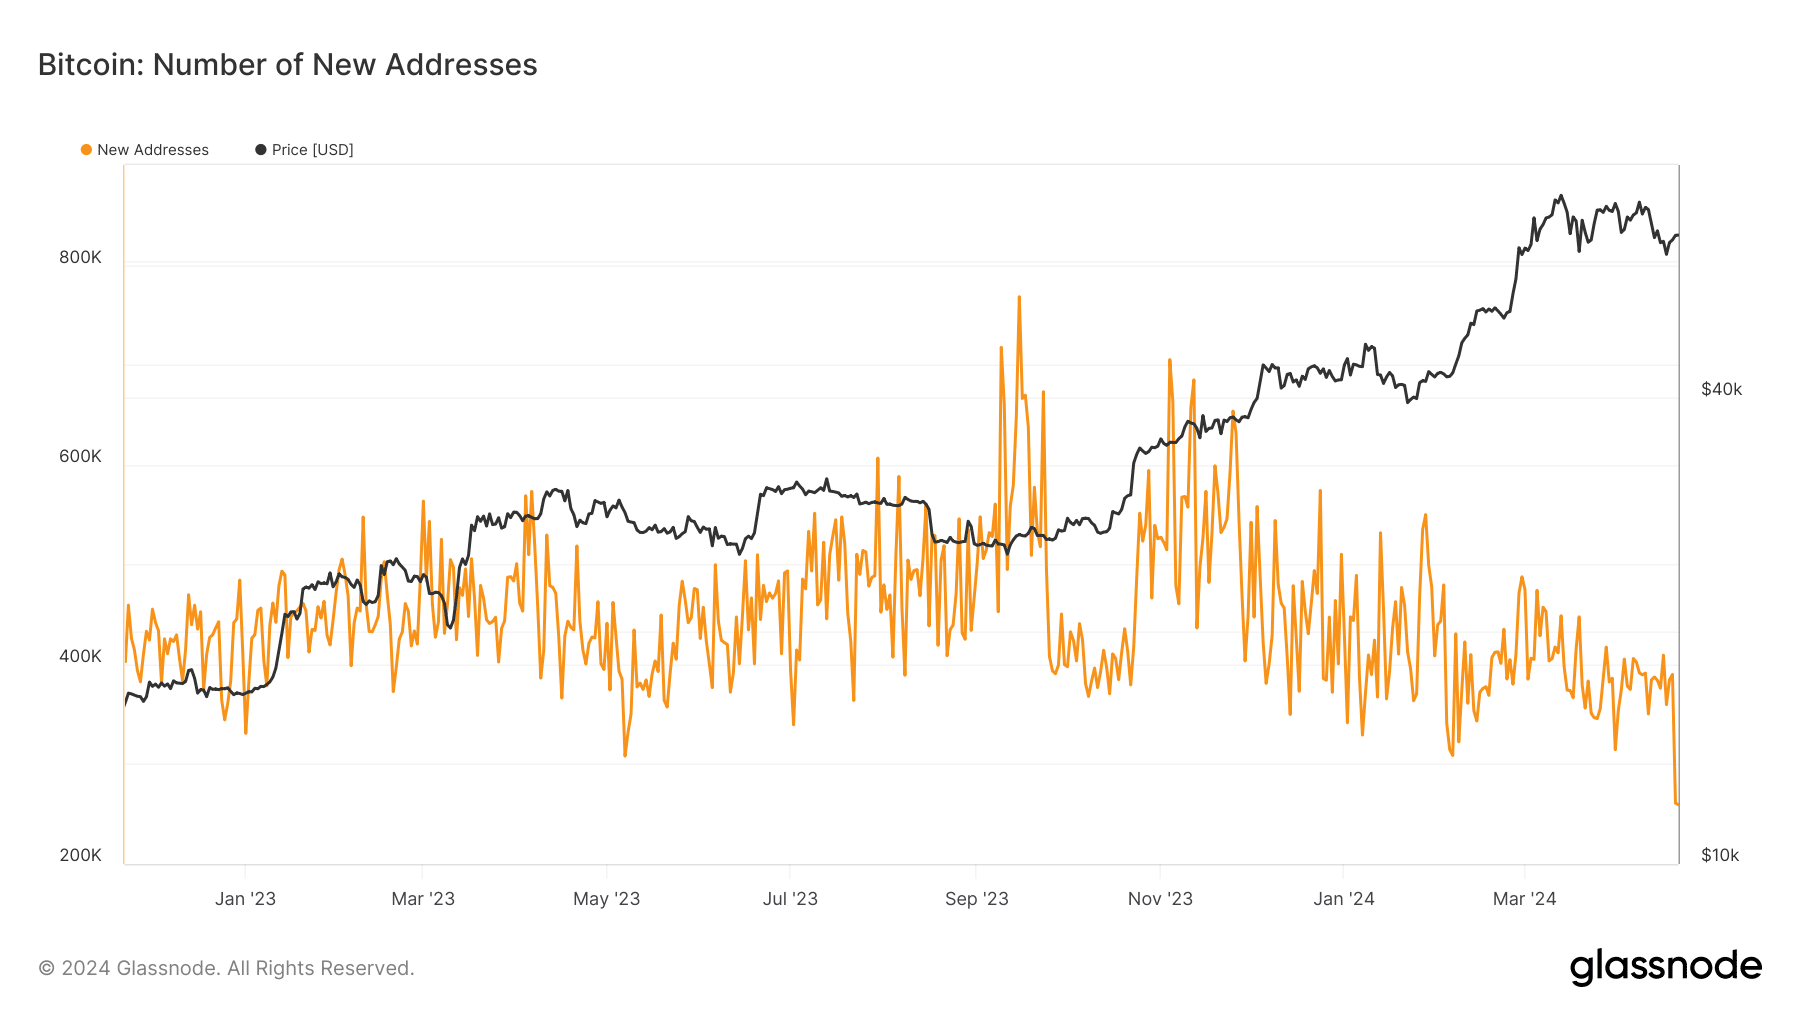
This trend suggested that a significant influx of new users didn’t drive the fee surge. Instead, the Runestone development likely played a role, with the subsequent fee drop supporting this hypothesis.
An increase in fees and new users indicates heightened activity, potentially impacting BTC price positively.
BTC goes back to $66,000
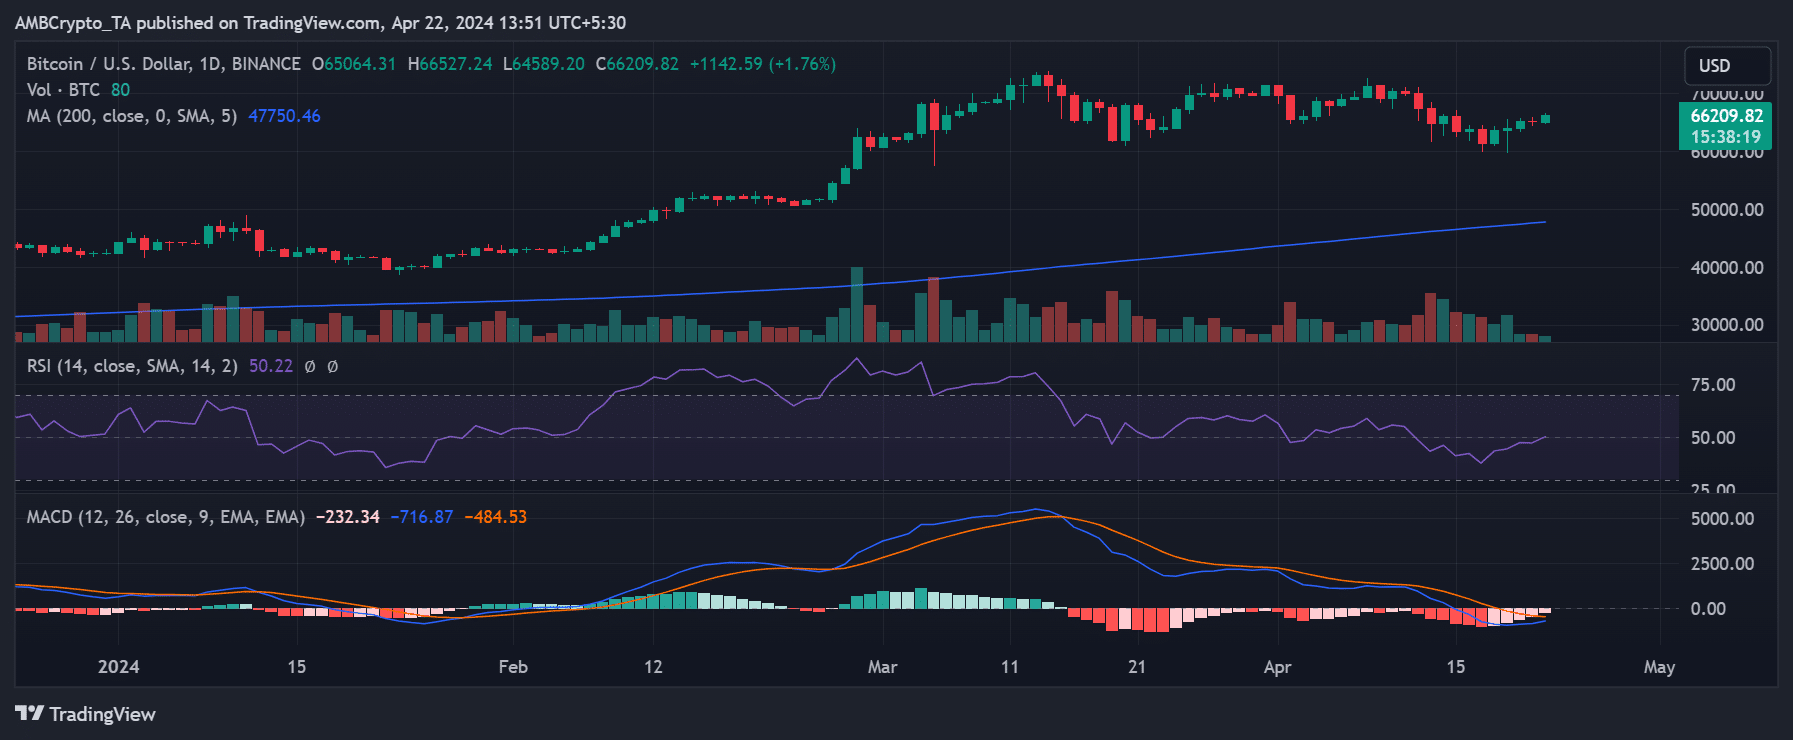
On the 21st of April, Bitcoin experienced a slight dip but quickly rebounded, as indicated by its daily timeframe price chart.
Read Bitcoin’s [BTC] Price Prediction 2024-25
AMBCrypto’s look at the chart revealed that at the time of writing, BTC was trading at approximately $66,200, reflecting a 1.7% increase.
However, its rally was not yet complete, as it still maintained a bearish trend. Breaking above this price range would signify a shift back into a bullish trend.