Aerodrome Finance [AERO] has grown into one of the most significant decentralized finance projects on the Base ecosystem.

The project was launched back in August 2023, and it was designed to solve a challenge that every blockchain faces in its early stages: liquidity. Without deep liquidity, trading becomes inefficient, slippage rises, and new projects struggle to attract customers. Aerodrome was designed to serve as Base’s primary liquidity hub, allowing users to swap assets while incentivizing liquidity providers to participate.

The project is not a traditional decentralized exchange. Instead, it combines several proven DeFi models into a single platform. Its architecture draws inspiration from protocols like Uniswap, Curve, and Velodrome. As a result, users gain access to efficient token swaps, concentrated liquidity, and incentive‑driven liquidity provision within a single ecosystem. Moreover, AERO sits at the center of that ecosystem.

Liquidity providers earn AERO rewards for supplying capital to trading pools. Meanwhile, long-term holders can lock their tokens to receive veAERO, a governance asset that grants voting rights and access to protocol fees. This structure aligns incentives between traders, liquidity providers, and token holders. The more activity generated on the platform, the stronger the potential rewards for participants, helping Aerodrome establish a dominant position on Base.

Over the past two years, the protocol has emerged as the network’s leading decentralized exchange by liquidity, trading volume, and fee generation. Various industry reports estimate that Aerodrome consistently handles most of Base’s decentralized exchange activity. 

Notably, on‑chain data shows that Aerodrome has over $100 million locked in, while trading volume has surpassed billions. Development has advanced alongside adoption, with a strong focus on capital efficiency and liquidity management.

Innovations such as concentrated liquidity have strengthened the protocol’s capabilities, enabling it to compete with larger decentralized exchanges. Meanwhile, ongoing collaboration with Velodrome highlights Aerodrome’s ambition to evolve into a cross‑platform liquidity protocol. 

Looking ahead, the protocol’s future will likely depend on two factors. The first is Base’s ability to continue attracting users and developers. The second is Aerodrome’s ability to maintain its position as the ecosystem’s primary liquidity venue.

So far, the project has executed well on both fronts. That explains why many investors view AERO as more than a decentralized exchange token. It is increasingly regarded as a direct indicator of the growth of DeFi activity on Base.

VIEW MORE

Overview

Market Cap
$484.54M
+5.0%
Volume (24H)
$29.02M
Volume (7D)
$164.67M
+7.1%
Max Supply
Circulating Supply
962,150,751 AERO
All-Time High
$2.32
-78.2%
All-Time Low
$0.000019
+2,708,817.8%
(above ATL)

Prediction Analysis

Current Price
$0.50
Sentiment
Bullish
50-Day SMA
$0.43
Price Prediction
$0.32
-34.90%
Fear & Greed Index
200-Day SMA
$0.41
Green Days
16 / last 30 (55.2%)
Volatility
6.31%
High
14-Day RSI
58.30
Neutral

Profit Calculator

Select asset
%
%
Total Profit
$0
(0%)
Total Exit Amount
$0
Total Investment Fee
$0
Total Exit Fee
$0

Aerodrome Finance Price Prediction

Current Price
$0.50
2031
$0.06
2036
$0.01
2041
$0.00
2046
$0.00

Results are based solely on your predicted price change. They are not indicators of future performance and do not take into account different performance scenarios, historical data, or the effect of fees or other charges.

VIEW MORE

Short-Term Aerodrome Finance Price Targets

Date Prediction Change
Jul 03, 2026 $0.50 +0.15%
Jul 04, 2026 $0.51 +0.31%
Jul 05, 2026 $0.51 +0.47%
Jul 06, 2026 $0.51 +0.62%
Jul 07, 2026 $0.51 +0.78%
Jul 08, 2026 $0.51 +0.93%
Jul 09, 2026 $0.51 +1.09%

The short-term outlook is beginning to improve despite the recent bearish structure. At press time, AERO remained below key daily EMAs, which suggests sellers still influence the market. However, the demand zone between $0.288 and $0.388 continues to attract buyers. More importantly, the imbalance around $0.33 has now been filled. That development removes a key downside objective and strengthens the case for stabilization. The recent reversal from support also highlights growing buyer interest. If the demand zone continues to hold, AERO could attempt a broader recovery. However, reclaiming the daily EMAs remains necessary for stronger bullish confirmation.

VIEW MORE

Monthly Aerodrome Finance Price Prediction

Jun 30, 2026
$0.48
Jul 2, 2026
$0.50
Highest in Jul
$0.52
Lowest in Jul
$0.46
Overall Performance
Rising

Long-Term Aerodrome Finance Price Prediction

Month Price AVG Price Max Price Change
Jul $0.31 $0.41 $0.41 -38.44%
Aug $0.20 $0.25 $0.25 -60.29%
Sep $0.12 $0.16 $0.16 -76.17%
Oct $0.08 $0.10 $0.10 -84.11%
Nov $0.05 $0.06 $0.06 -90.07%
Dec $0.03 $0.04 $0.04 -94.04%
In 2026, Aerodrome Finance (AERO) is anticipated to trade between $0 and $0 , leading to an average annualized price of $0 . This could result in a potential return on investment of -66.24% compared to the current price.
VIEW MORE

Historical Price Performance

Year Highest Price Lowest Price
2026 (to date) $1 $0
2025 $2 $0
2024 $2 $0
2023 $0 $0

AERO turned out to be one of the best-performing tokens during Base's rapid expansion phase in 2024. With rising liquidity and trading volumes flowing into the ecosystem, Aerodrome solidified its role as the leading decentralized exchange on Base, attracting strong investor interest. Increased adoption, higher trading activity, and growing revenues enabled AERO to deliver notable returns during the DeFi market recovery. However, like all ecosystem‑dependent tokens, its performance remains closely tied to the network’s growth. Whenever Base’s growth slowed, AERO’s momentum weakened. The token is now in a correction phase, though the fundamentals of the protocol remain intact.

VIEW MORE

Technical Analysis

The longer-term structure continues to favor the bulls, but recent price action shows that sellers are still applying pressure.

Source: TradingView

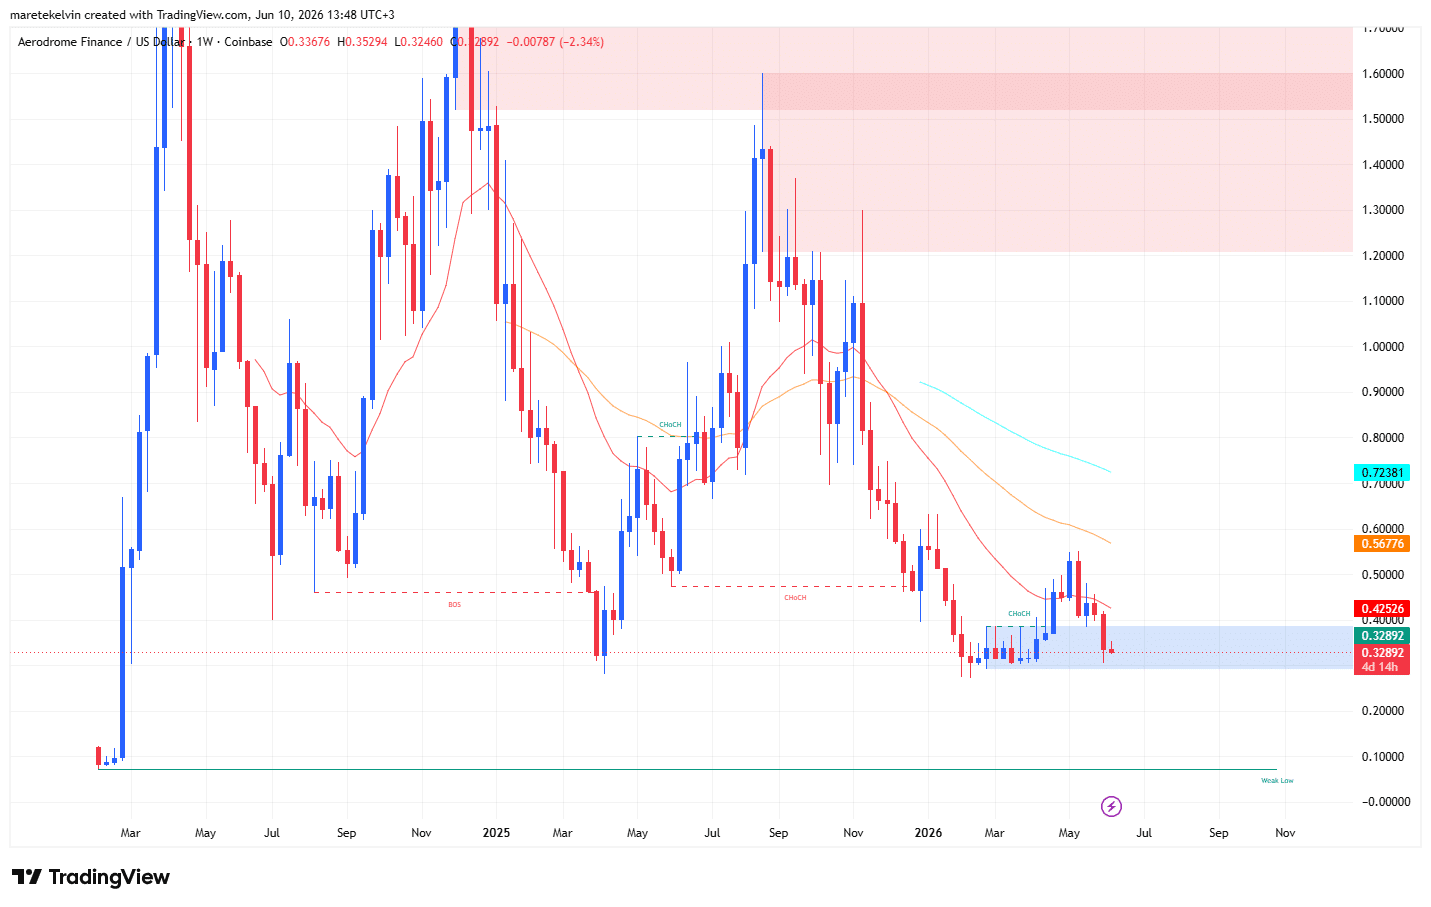
On the weekly chart, AERO is testing a major demand zone between $0.288 and $0.388. This area has become the market’s primary line of defense after nearly a month of persistent selling. So far, buyers have managed to prevent a deeper decline. However, the recovery remains incomplete.

A key concern is that price continued to trade below major EMA levels at press time, suggesting the broader trend has weakened despite the presence of strong demand underneath the market.

The daily chart provides additional context.

Source: TradingView

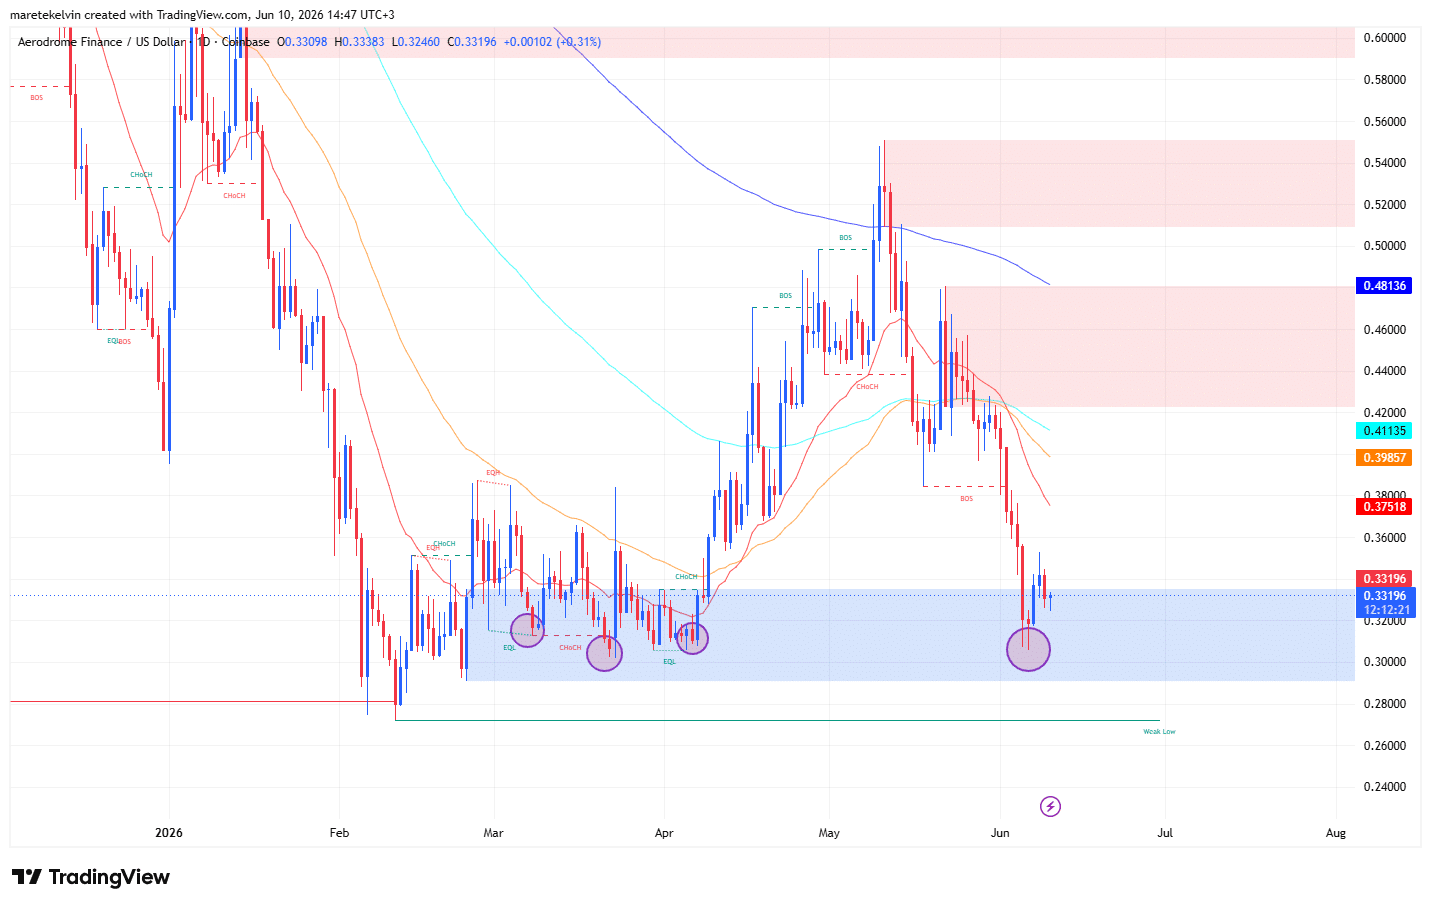
Here, the structure has already shifted bearish. Price remained below key EMAs, confirming that sellers held the short-term advantage. However, the demand zone appears far more resilient on this timeframe.

Since late 2024, the area has triggered roughly five successful reversals. The most recent reaction occurred on the 6th of June, 2026, when buyers stepped in once again to defend support. Another encouraging sign is the recent fill of the imbalance zone around $0.33. With that inefficiency now cleared, short-term price action has started to align more closely with the bulls.

For now, the market remains at a critical decision point. Buyers are defending an important demand zone, while sellers continue to benefit from the broader loss of momentum.

Guides

How to Read Aerodrome Finance Charts and Predict Price Movements?

Most traders use candlestick charts, as they provide more information than a simple line chart. Traders can view candlesticks that represent the price action of Aerodrome Finance with different granularity – for example, you could choose a 5-minute candlestick chart for extremely short-term price action or choose a weekly candlestick chart to identify long-term trends. 1-hour, 4-hour, and 1-day candlestick charts are among the most popular.

Let’s use a 1-hour candlestick chart as an example of how this type of price chart gives us information about opening and closing prices. The chart is divided into “candles” that give us information about Aerodrome Finance’s price action in 1-hour chunks. Each candlestick will display the asset’s opening price, closing price, as well as the highest and lowest prices reached within that period.

Aerodrome Finance Price Prediction Indicators

Moving averages are among the most popular Aerodrome Finance price prediction tools. As the name suggests, a moving average provides the average closing price over a selected time frame, which is divided into a number of periods of the same length. For example, a 12-day simple moving average is calculated by summing the closing prices over the last 12 days and dividing the result by 12.

In addition to the simple moving average (SMA), traders also use another type of moving average called the exponential moving average (EMA). The EMA gives more weight to recent prices, and therefore reacts more quickly to changes in market conditions.

What Affects the Price of Aerodrome Finance?

Just like with any other asset, the price action of Aerodrome Finance is driven by supply and demand. These dynamics can be influenced by fundamental events such as block reward halvings, hard forks, or new protocol updates. Regulations, adoption by companies and governments, cryptocurrency exchange hacks, and other real-world events can also affect market sentiment.

Technical indicators such as moving averages, RSI, and trading volume are also used by traders to anticipate price movements and identify potential trend reversals.

FAQs on Aerodrome Finance Price Predictions

As of today, Aerodrome Finance (AERO) is trading at $0.503596. The current market sentiment is Bullish, with RSI at 58.3 (Neutral) and volatility classified as High.
Based on our technical analysis and projected annual growth rate, Aerodrome Finance could reach $0.327841 by 2027. This estimate assumes continued market momentum and adoption trends.
According to our technical analysis indicators, the Aerodrome Finance price prediction is forecasted to reach $0.058883 within the next five years (by 2031). Over the last 30 days, Aerodrome Finance recorded green days 55% of the time.
Based on multiple technical indicators, the current outlook for Aerodrome Finance in 2026 is Bullish. RSI currently sits at 58.3, which indicates Neutral momentum. However, investors should evaluate both technical signals and fundamental developments before making any investment decisions.
Based on long-term projections and historical crypto market cycles, Aerodrome Finance could reach $0.01 within the next decade (by 2036).
While Aerodrome Finance's future value depends on various factors, technical indicators suggest it could experience both bullish and bearish cycles over time. Long-term investors typically monitor RSI levels, moving averages, and broader market sentiment when evaluating AERO's future trajectory.
Disclaimer

AMBCrypto's content is meant to be informational in nature and should not be interpreted as investment advice. Trading, buying or selling cryptocurrencies should be considered a high-risk investment and every reader is advised to do their own research before making any decisions.