FLR is the native token of Flare Network. Flare is a Layer 1 blockchain that is compatible with the Ethereum blockchain.

It was co-founded in 2019 by Hugo Philion, Dr. Nairi Usher, and Dr. Sean Rowan. They met at the University College London (UCL) while studying Machine Learning. Philion served as the CEO, Nairi was the Chief Scientist, and Rowan was the Chief Technology Officer (CTO). However, it launched its mainnet in January 2023. 

The network uses the Proof-of-Stake (PoS) mechanism.

Flare Network is important to the ecosystem because it serves as the blockchain for data. It provides developers with decentralized, secure access to high-integrity information from other chains. The network utilizes two core native oracles to bring external data to the blockchain. They include Flare Time Series Oracle (FTSO) and State Connector. 

Flare Network investors and backers raised over $56 million across three funding rounds as per Cryptorank. The institutions contributed $35 million, $11 million, and over $10 million, with the second contribution supporting initial seed capital through a public sale. These early investors were Kenetic Capital, CoinFund, Digital Currency Group (DCG), and Aves Lair. Other institutions include Xpring Capital, Borderless Capital, LD Capital, New Form Capital, and Wave Financial. 

Regarding its tokenomics, Flare has a total supply of slightly above 105 billion FLR tokens.

Originally, there was a 36-month public distribution plan that concluded in January 2026. However, the current circulating supply stands at 85.49 billion FLR. Initial allocation of 59% of the supply was dedicated to the community, with the remainder split between early backers, the Flare Foundation, and ecosystem development.

To protect overall dilution, Flare permanently burned 2.1 billion FLR in October 2023, which was equivalent to 2% of the supply. Afterwards, more than 199 million were burned immediately, followed by 66.3 million monthly until January 2026. The Fully Diluted Value (FDV) of FLR stood at $738 million.

To reach where it is, the network has seen a couple of developments alongside upcoming ones as crypto continues to advance.

After it was founded in 2019, Flare launched its testing network in 2021, dubbed Songbird Canary. The Genesis Launch happened in July 2022, followed by the Token Distribution Event (TDE) in January 2023, airdropping FLR tokens to XRP holders. In April 2026, Flare opened voting for the FIP.16 governance proposal to cut annual FLR inflation, which was standing at 10%, and introduce stronger token burns. The FIP.16 would be implemented in late June of the same year. 

In Q2 of 2026, the Firelight Phase 2 Launch will activate decentralized finance (DeFi) insurance and stXRP staking, deepening the utility of the XRPFi ecosystem. In Q3 2026, Flare 2.0 Confidential Compute will introduce privacy features using Trusted Execution Environments (TEEs). This upgrade was to prepare for institutional DeFi and real-world assets (RWAs). Then, Flare would bring native Bitcoin [BTC] in late 2026 through FBTC Integration.

Notably, Flare has not experienced any network vulnerability that is solely linked to it. There was a Fake Token Exit Scam in November 2022, a malicious smart contract acting as a fake “Flare token,” taking advantage of early token distribution. However, its cross-chain interoperability protocol, LayerZero, which powers Flare’s bridging structure, experienced issues in April 2026. Its social platforms have been compromised.

For instance, a Discord Takeover in June 2023 and an X/Twitter account for Flare Dev Hub in February 2026. Meanwhile, Airdrop Drainers have continued since 2025. 

In the DeFi sector, the Total Value Locked (TVL) has been growing since 2025, reaching a peak of $451 million. However, the TVL has dipped to around $373 million alongside stablecoins’ market cap, which was at $54 million, as per DeFiLlama.


VIEW MORE

Overview

Market Cap
$565.00M
+0.8%
Volume (24H)
$3.18M
Volume (7D)
$17.56M
-3.9%
Max Supply
Circulating Supply
86,791,029,573 FLR
All-Time High
$0.150073
-95.7%
All-Time Low
$0.006333
+2.8%
(above ATL)

Prediction Analysis

Current Price
$0.01
Sentiment
Bearish
50-Day SMA
$0.01
Price Prediction
$0.00
-62.39%
Fear & Greed Index
200-Day SMA
$0.01
Green Days
10 / last 30 (34.5%)
Volatility
1.94%
Low
14-Day RSI
53.20
Neutral

Profit Calculator

Select asset
%
%
Total Profit
$0
(0%)
Total Exit Amount
$0
Total Investment Fee
$0
Total Exit Fee
$0

Flare Price Prediction

Current Price
$0.01
2031
$0.00
2036
$0.00
2041
$0.00
2046
$0.00

Results are based solely on your predicted price change. They are not indicators of future performance and do not take into account different performance scenarios, historical data, or the effect of fees or other charges.

VIEW MORE

Short-Term Flare Price Targets

Date Prediction Change
Jul 15, 2026 $0.01 +1.42%
Jul 16, 2026 $0.01 +2.86%
Jul 17, 2026 $0.01 +4.31%
Jul 18, 2026 $0.01 +5.79%
Jul 19, 2026 $0.01 +7.29%
Jul 20, 2026 $0.01 +8.81%
Jul 21, 2026 $0.01 +10.35%

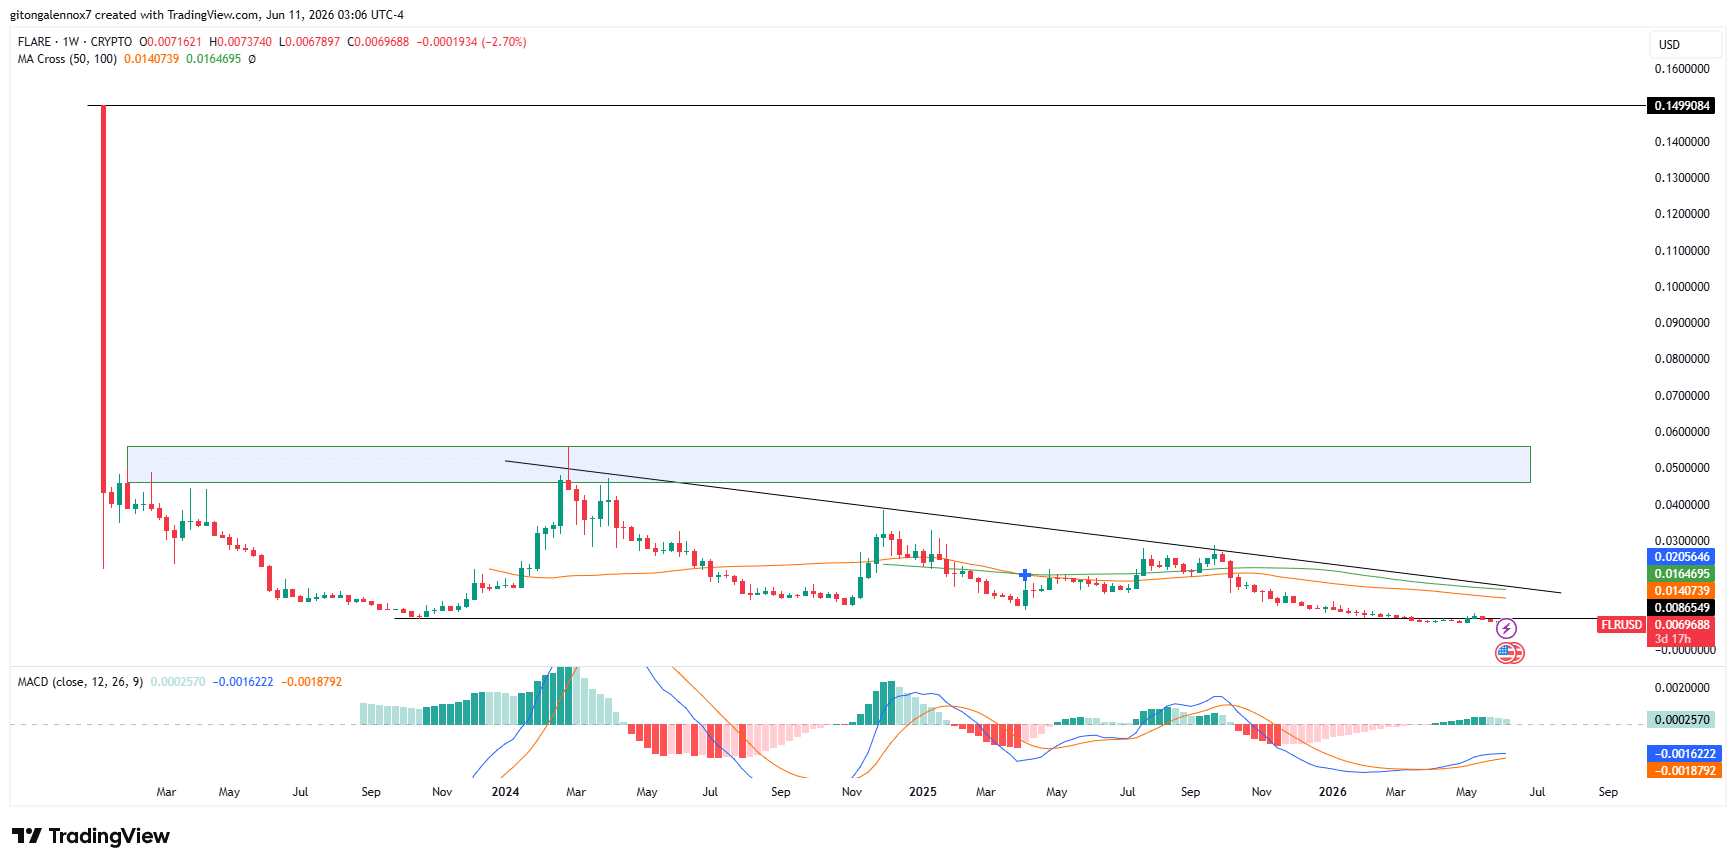
The short-term structure remained bearish after FLR slipped below the triangle's support zone and traded near $0.007. A recovery above the broken support would place the token back into consolidation. A bullish reversal would require a breakout above the triangle resistance and a move above key Moving Averages. Momentum indicators offered some encouragement. The MACD continued to improve, suggesting buyers were gradually returning. If momentum strengthens further, upside targets sit near $0.026, $0.040, and $0.050.

VIEW MORE

Monthly Flare Price Prediction

Jun 30, 2026
$0.01
Jul 14, 2026
$0.01
Highest in Jul
$0.01
Lowest in Jul
$0.01
Overall Performance
Rising

Long-Term Flare Price Prediction

Month Price AVG Price Max Price Change
Jul $0.01 $0.01 $0.01 +53.56%
Aug $0.00 $0.00 $0.00 -100.00%
Sep $0.00 $0.00 $0.00 -100.00%
Oct $0.00 $0.00 $0.00 -100.00%
Nov $0.00 $0.00 $0.00 -100.00%
Dec $0.00 $0.00 $0.00 -100.00%
In 2026, Flare (FLR) is anticipated to trade between $0 and $0 , leading to an average annualized price of $0 . This could result in a potential return on investment of -74.41% compared to the current price.
VIEW MORE

Historical Price Performance

Year Highest Price Lowest Price
2026 (to date) $0 $0
2025 $0 $0
2024 $0 $0
2023 $0 $0

FLR remained more than 90% below its all-time high, reflecting its prolonged post-launch decline. The token's performance has closely tracked broader crypto market sentiment. Major market selloffs have accelerated downside pressure, while periods of improved sentiment have produced temporary recoveries. The late-2023 rally demonstrated FLR's ability to recover during favorable conditions. However, broader market weakness since late 2025 has continued to weigh on price action.

VIEW MORE

Technical Analysis

FLR has remained in a long-term downtrend since its January 2023 launch.

The token debuted near $0.15 before falling to around $0.023 within days. A brief recovery followed, pushing FLR toward $0.05, but buyers failed to sustain momentum.

Since then, the $0.05 region has capped every major recovery attempt.

At press time, FLR traded inside a multi-year triangle pattern, bounded by a descending trendline and horizontal support near $0.0086.

Source: FLR/USD weekly chart on TradingView

The 50-week and 100-week Moving Averages continued to slope lower, reinforcing the broader bearish trend.

Even so, momentum indicators hinted at a possible shift. The MACD histogram remained positive, suggesting buying pressure was beginning to return. The MACD line also stayed above the signal line, supporting a cautiously bullish outlook.

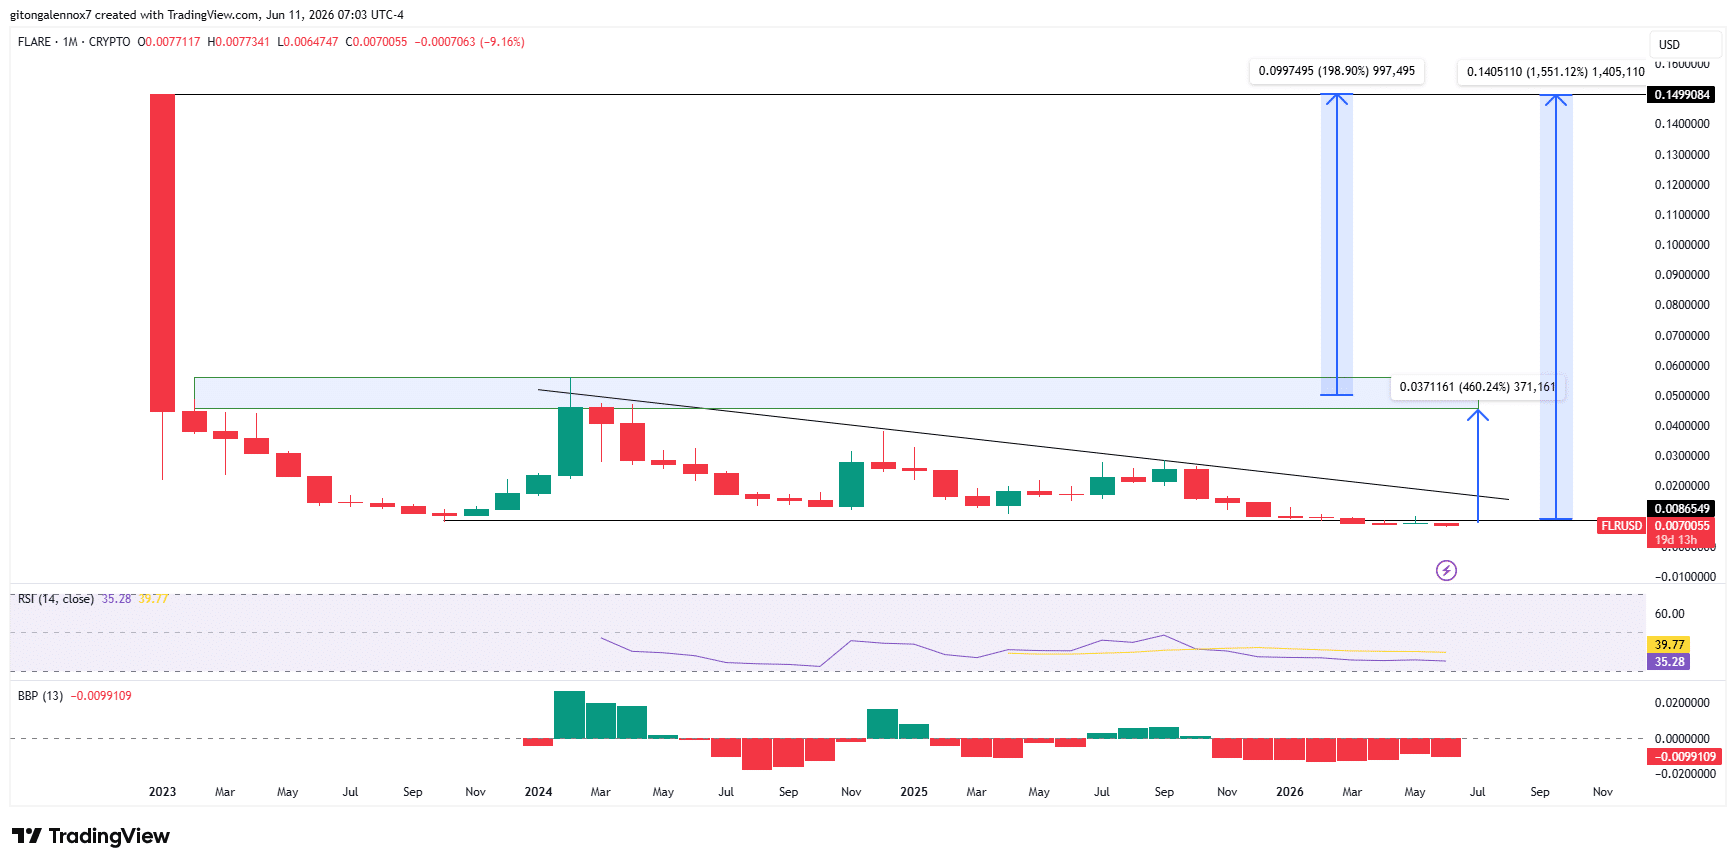
The monthly chart reflected a similar trend.

Source: FLR/USD monthly chart on TradingView

The RSI declined through most of 2025 before stabilizing near 35. Meanwhile, Bull-Bear Power remained negative, highlighting persistent weakness despite improving momentum.

Guides

How to Read Flare Charts and Predict Price Movements?

Most traders use candlestick charts, as they provide more information than a simple line chart. Traders can view candlesticks that represent the price action of Flare with different granularity – for example, you could choose a 5-minute candlestick chart for extremely short-term price action or choose a weekly candlestick chart to identify long-term trends. 1-hour, 4-hour, and 1-day candlestick charts are among the most popular.

Let’s use a 1-hour candlestick chart as an example of how this type of price chart gives us information about opening and closing prices. The chart is divided into “candles” that give us information about Flare’s price action in 1-hour chunks. Each candlestick will display the asset’s opening price, closing price, as well as the highest and lowest prices reached within that period.

Flare Price Prediction Indicators

Moving averages are among the most popular Flare price prediction tools. As the name suggests, a moving average provides the average closing price over a selected time frame, which is divided into a number of periods of the same length. For example, a 12-day simple moving average is calculated by summing the closing prices over the last 12 days and dividing the result by 12.

In addition to the simple moving average (SMA), traders also use another type of moving average called the exponential moving average (EMA). The EMA gives more weight to recent prices, and therefore reacts more quickly to changes in market conditions.

What Affects the Price of Flare?

Just like with any other asset, the price action of Flare is driven by supply and demand. These dynamics can be influenced by fundamental events such as block reward halvings, hard forks, or new protocol updates. Regulations, adoption by companies and governments, cryptocurrency exchange hacks, and other real-world events can also affect market sentiment.

Technical indicators such as moving averages, RSI, and trading volume are also used by traders to anticipate price movements and identify potential trend reversals.

FAQs on Flare Price Predictions

As of today, Flare (FLR) is trading at $0.006512. The current market sentiment is Bearish, with RSI at 53.2 (Neutral) and volatility classified as Low.
Based on our technical analysis and projected annual growth rate, Flare could reach $0.002449 by 2027. This estimate assumes continued market momentum and adoption trends.
According to our technical analysis indicators, the Flare price prediction is forecasted to reach $0.000049 within the next five years (by 2031). Over the last 30 days, Flare recorded green days 35% of the time.
Based on multiple technical indicators, the current outlook for Flare in 2026 is Bearish. RSI currently sits at 53.2, which indicates Neutral momentum. However, investors should evaluate both technical signals and fundamental developments before making any investment decisions.
Long-term forecasts indicate that Flare may continue to grow over the next decade if adoption, technology development, and global crypto demand continue to expand.
While Flare's future value depends on various factors, technical indicators suggest it could experience both bullish and bearish cycles over time. Long-term investors typically monitor RSI levels, moving averages, and broader market sentiment when evaluating FLR's future trajectory.
Disclaimer

AMBCrypto's content is meant to be informational in nature and should not be interpreted as investment advice. Trading, buying or selling cryptocurrencies should be considered a high-risk investment and every reader is advised to do their own research before making any decisions.