Virtuals Protocol [VIRTUAL] is an AI-agent infrastructure project built around the idea that autonomous agents can become revenue-generating actors on-chain. The protocol focuses on agents that can create services, transact, coordinate with other agents, and go on to operate like tokenized businesses!

The project was founded in 2021 by Jansen Teng and Tiew Wee Kee. It initially came from the PathDAO ecosystem, which was more focused on gaming and digital communities. Over time, the focus moved to AI agents.

The core idea is co-ownership. When an AI agent is launched through the protocol, it can be tokenized, allowing users to participate in that agent’s ecosystem. The agent becomes an on-chain asset with its own token and liquidity. This is what makes Virtuals different from many AI-themed crypto projects. 

The VIRTUAL token is the base asset for agent tokens, meaning new agent tokens are paired with VIRTUAL in their liquidity pools. Users also need VIRTUAL to access and trade many assets within the Virtuals ecosystem. 

Virtuals has three major infrastructure pillars – Agent tokenization, the GAME framework, and the Agent Commerce Protocol, or ACP. The tokenization layer helps founders launch and fund AI agents. GAME is the agentic framework that gives agents the ability to plan, make decisions, use tools, and act based on goals and context. ACP is the commerce layer, allowing agents to discover services, negotiate work, use escrow, evaluate outcomes, and settle payments on-chain.

By June 2026, ACP became one of the most important parts of the Virtuals roadmap. The protocol introduced ACP v2 in 2026 after onboarding more than 2,000 agents! The long-term value of AI agents depends on whether they can move beyond social posts and simple API actions into actual workflows that users or other agents are willing to pay for.

Virtuals has also been building new capital formation models for agent founders. Its “60 Days” plan gives builders a trial period to prove demand before making a longer-term commitment. Automated Capital Formation is designed to release resources based on actual activity, rather than giving teams large upfront allocations with little accountability. 

Virtuals Protocol reported more than 18,000 agents deployed and over $470 million in Agentic GDP – A metric used by the project to describe the economic value generated across its agent economy. The launch of the Virtuals Revenue Network in 2026 distributed protocol-funded incentives to agents that sell services through ACP.

Key areas to watch include ACP adoption, Revenue Network activity, the 60 Days launch model, GAME developer usage, Virtuals Ventures-backed projects. One must also follow whether agents can generate recurring revenue from real services, to ascertain the value of this project.

VIEW MORE

Overview

Market Cap
$369.99M
-7.2%
Volume (24H)
$50.21M
Volume (7D)
$340.29M
-14.6%
Max Supply
1,000,000,000 VIRTUAL
Circulating Supply
657,514,321 VIRTUAL
All-Time High
$5.07
-88.9%
All-Time Low
$0.007486
+7,424.4%
(above ATL)

Prediction Analysis

Current Price
$0.56
Sentiment
Bearish
50-Day SMA
$0.58
Price Prediction
$0.21
-62.30%
Fear & Greed Index
200-Day SMA
$0.69
Green Days
12 / last 30 (41.4%)
Volatility
4.45%
Moderate
14-Day RSI
43.34
Neutral

Profit Calculator

Select asset
%
%
Total Profit
$0
(0%)
Total Exit Amount
$0
Total Investment Fee
$0
Total Exit Fee
$0

Virtuals Protocol Price Prediction

Current Price
$0.56
2031
$0.00
2036
$0.00
2041
$0.00
2046
$0.00

Results are based solely on your predicted price change. They are not indicators of future performance and do not take into account different performance scenarios, historical data, or the effect of fees or other charges.

VIEW MORE

Short-Term Virtuals Protocol Price Targets

Date Prediction Change
Jul 29, 2026 $0.55 -2.16%
Jul 30, 2026 $0.54 -4.27%
Jul 31, 2026 $0.53 -6.34%
Aug 01, 2026 $0.52 -8.36%
Aug 02, 2026 $0.50 -10.34%
Aug 03, 2026 $0.49 -12.27%
Aug 04, 2026 $0.48 -14.16%

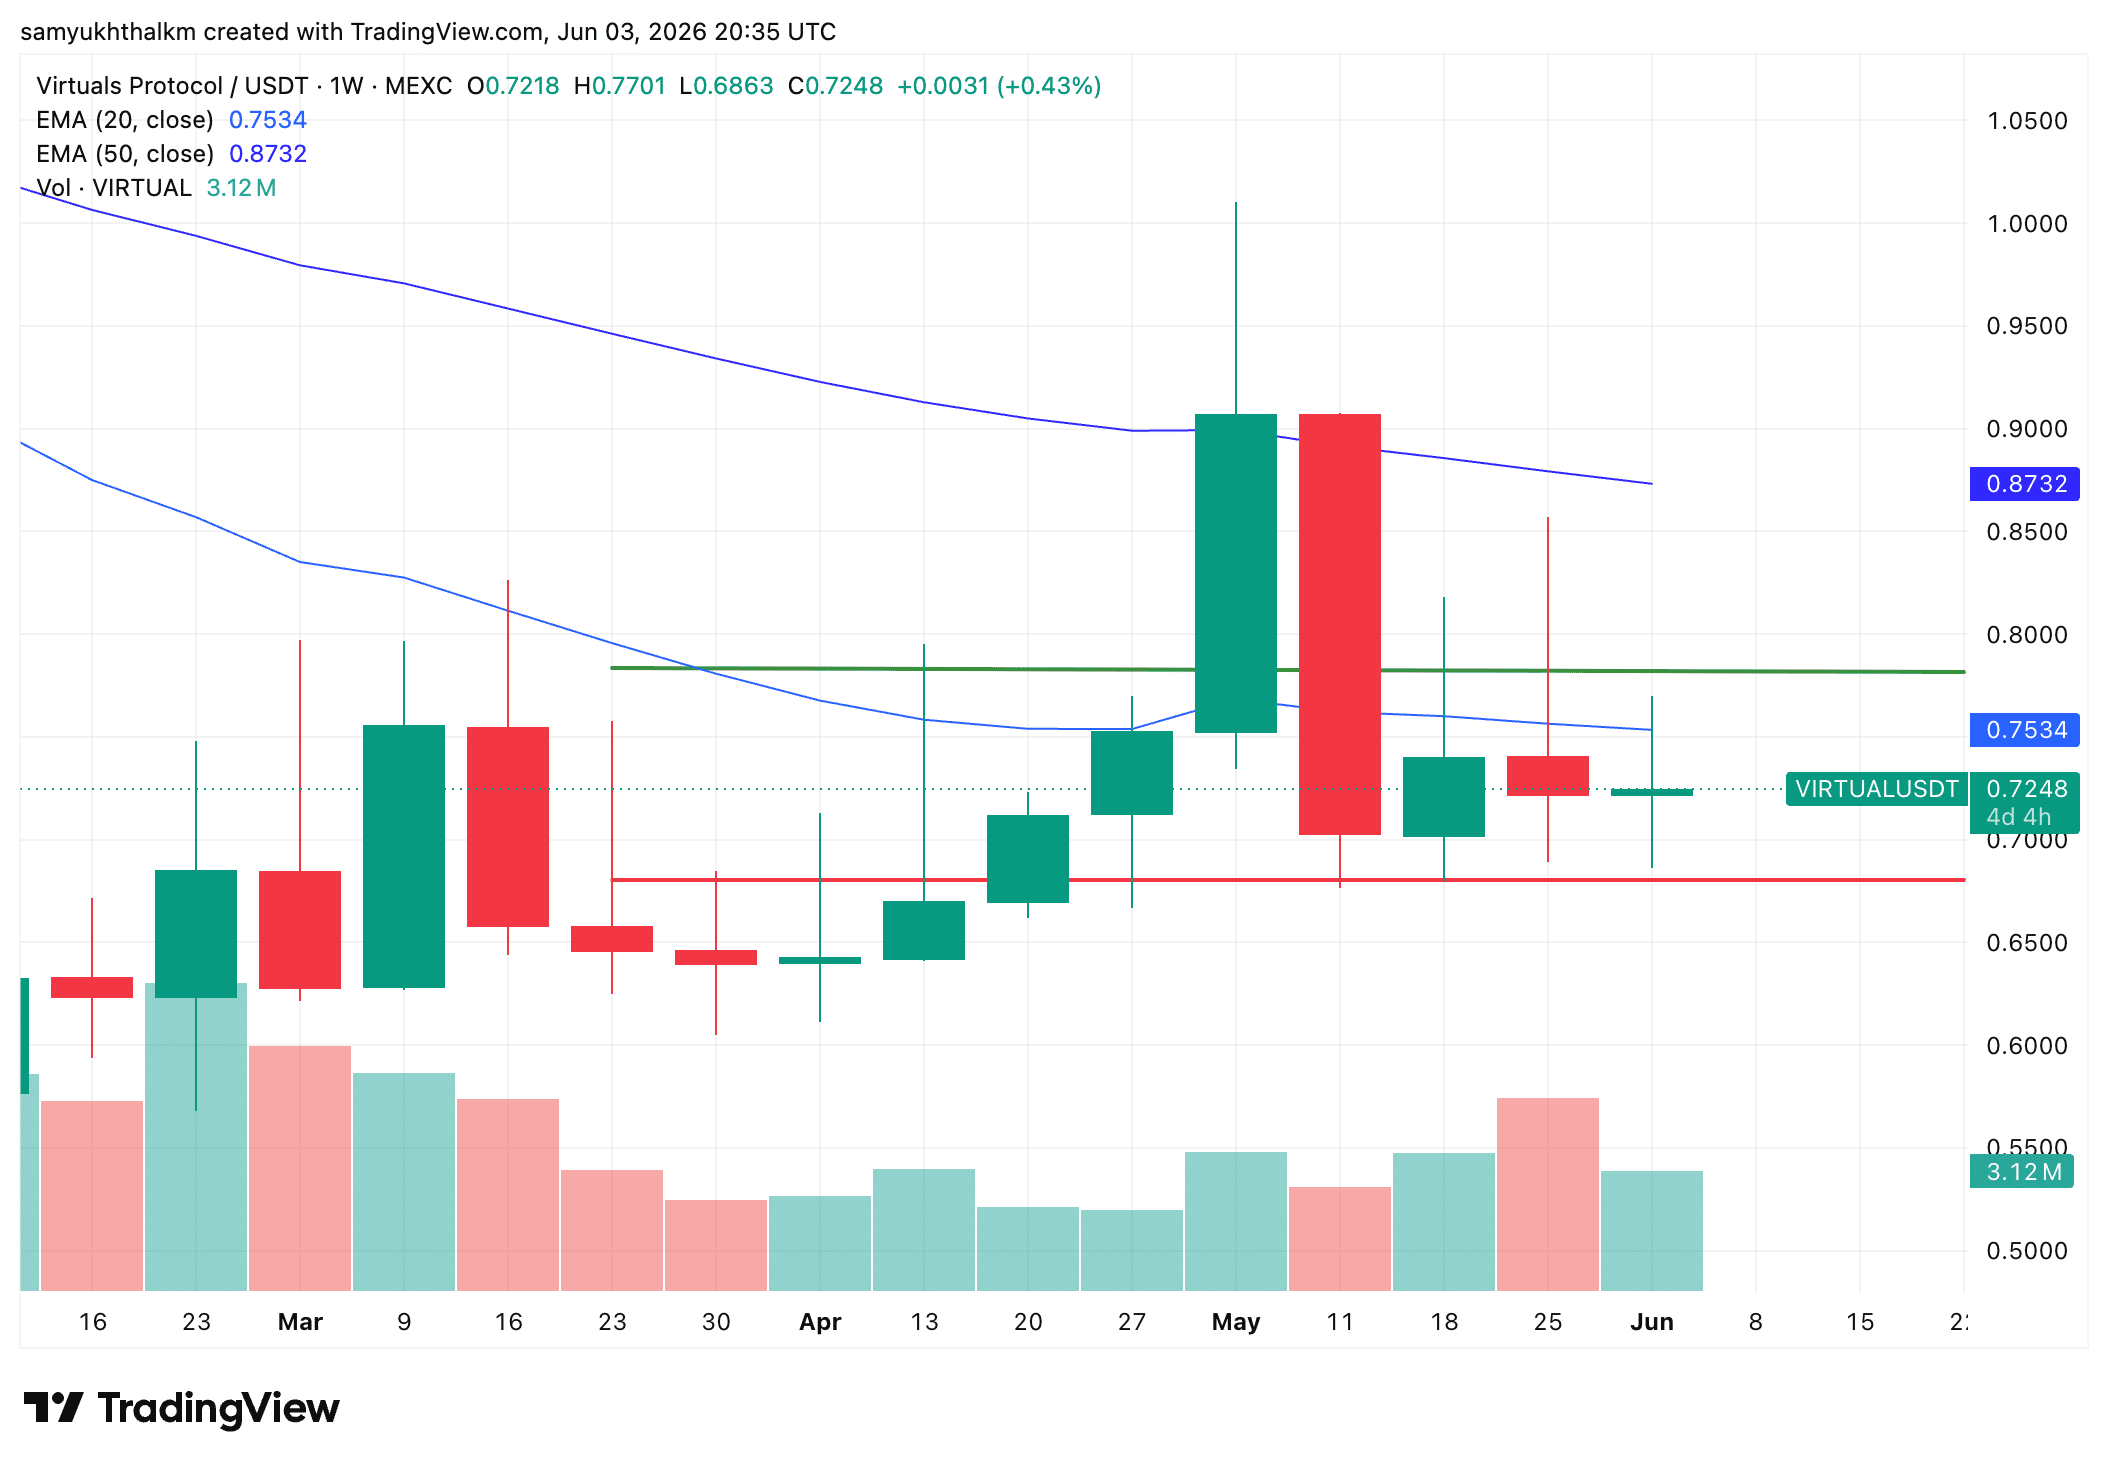
In June 2026, the short-term verdict was neutral for VIRTUAL. Especially since it continued to trade between $0.68 and $0.78. Buyers seemed to be defending the lower range, but the token was still below the 20-week EMA - Limiting upside momentum. A move above $0.78 would improve the setup and could push VIRTUAL up. However, if the price breaks below $0.68, the short-term structure would weaken.

VIEW MORE

Monthly Virtuals Protocol Price Prediction

Jun 30, 2026
$0.52
Jul 28, 2026
$0.57
Highest in Jul
$0.67
Lowest in Jul
$0.52
Overall Performance
Rising

Long-Term Virtuals Protocol Price Prediction

Month Price AVG Price Max Price Change
Jul $0.53 $0.55 $0.55 -5.80%
Aug $0.50 $0.51 $0.51 -11.13%
Sep $0.47 $0.48 $0.48 -16.46%
Oct $0.44 $0.45 $0.45 -21.79%
Nov $0.41 $0.42 $0.42 -27.13%
Dec $0.39 $0.40 $0.40 -30.68%
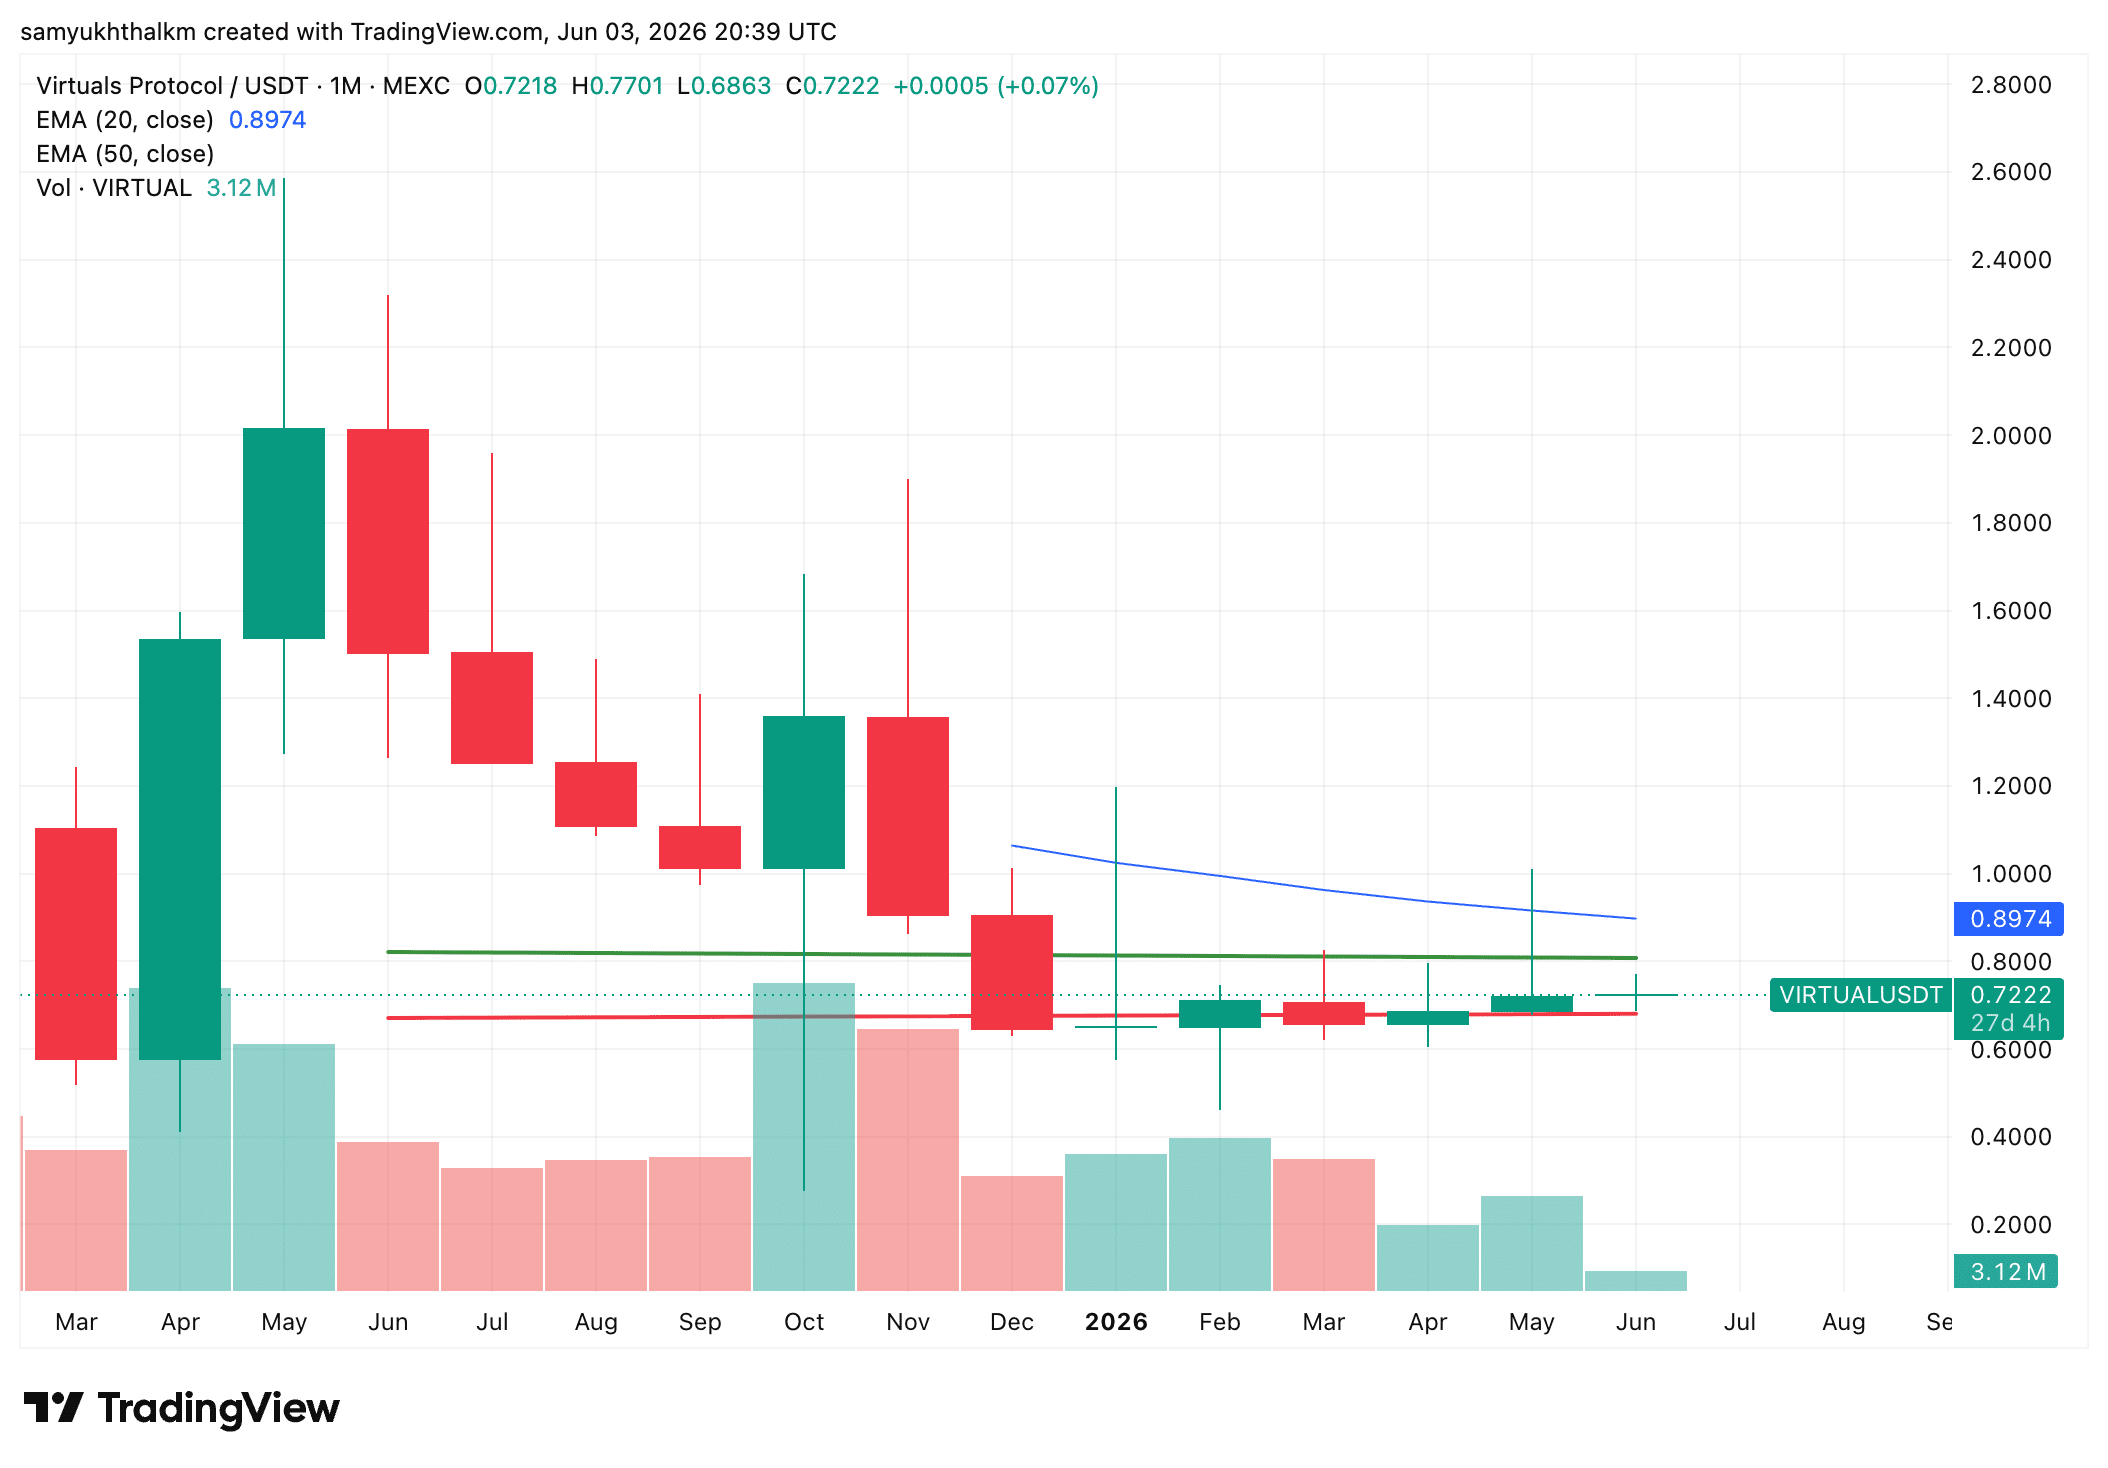
The long-term prediction for VIRTUAL depends heavily on whether its base holds. In June 2026, the altcoin seemed to be consolidating around the $0.65-$0.80 range after a long correction. While selling pressure dipped, the confirmation for greener pastures was still missing. The 20-month EMA on the monthly chart will be the key level to reclaim. If VIRTUAL closes above $0.90, it could attempt a move up. A stronger long-term recovery would need prolonged movement above that zone. Until then, the long-term outlook will remain cautious.
VIEW MORE

Historical Price Performance

Year Highest Price Lowest Price
2026 (to date) $1 $1
2025 $5 $0
2024 $4 $0
2023 $0 $0

VIRTUAL has had a wild price history since it began trading in December 2023.. For most of early 2024, the token traded near the lower end of its range before pace picked up towards the end of the year. Its strongest visible rally came around late 2024 and early 2025, when interest in AI-agent skyrocketed. However, that was followed by a correction in later 2025. VIRTUAL tried to recover again, but it failed to sustain higher levels. Since early 2026, the token has mostly moved sideways.

VIEW MORE

Technical Analysis

VIRTUAL’s weekly chart showed that the token was trying to stabilize, but didn’t quite have the strength for it yet. At the time of writing in June 2026, it was valued at $0.72; above the $0.68-$0.70 support zone but still below the 20-week EMA and the 50-week EMA. The short-term structure seemed to be neutral/cautious.

Source: VIRTUAL/USDT, TradingView

While buyers have defended the lower range, VIRTUAL still needs to go above $0.78 to show better pace. After that, the next important resistance will be around $0.87-$0.90. Here, the 50-week EMA will also come into play.

The monthly chart appeared very similar, yet different. VIRTUAL spent much of 2026 moving sideways around the $0.65-$0.80 range, so selling pressure fell. However, the token was still below the 20-month EMA near $0.8974 – Evidence that the larger trend wasn’t bullish yet. 

Source: VIRTUAL/USDT, TradingView

A monthly close above $0.80-$0.90 would be the first sign of recovery. Until then, $0.68-$0.70 will be the key support area. A breakdown below this zone could expose VIRTUAL to $0.60 range, while a breakout above $0.90 could open the way towards levels above $1!

Guides

How to Read Virtuals Protocol Charts and Predict Price Movements?

Most traders use candlestick charts, as they provide more information than a simple line chart. Traders can view candlesticks that represent the price action of Virtuals Protocol with different granularity – for example, you could choose a 5-minute candlestick chart for extremely short-term price action or choose a weekly candlestick chart to identify long-term trends. 1-hour, 4-hour, and 1-day candlestick charts are among the most popular.

Let’s use a 1-hour candlestick chart as an example of how this type of price chart gives us information about opening and closing prices. The chart is divided into “candles” that give us information about Virtuals Protocol’s price action in 1-hour chunks. Each candlestick will display the asset’s opening price, closing price, as well as the highest and lowest prices reached within that period.

Virtuals Protocol Price Prediction Indicators

Moving averages are among the most popular Virtuals Protocol price prediction tools. As the name suggests, a moving average provides the average closing price over a selected time frame, which is divided into a number of periods of the same length. For example, a 12-day simple moving average is calculated by summing the closing prices over the last 12 days and dividing the result by 12.

In addition to the simple moving average (SMA), traders also use another type of moving average called the exponential moving average (EMA). The EMA gives more weight to recent prices, and therefore reacts more quickly to changes in market conditions.

What Affects the Price of Virtuals Protocol?

Just like with any other asset, the price action of Virtuals Protocol is driven by supply and demand. These dynamics can be influenced by fundamental events such as block reward halvings, hard forks, or new protocol updates. Regulations, adoption by companies and governments, cryptocurrency exchange hacks, and other real-world events can also affect market sentiment.

Technical indicators such as moving averages, RSI, and trading volume are also used by traders to anticipate price movements and identify potential trend reversals.

FAQs on Virtuals Protocol Price Predictions

As of today, Virtuals Protocol (VIRTUAL) is trading at $0.562623. The current market sentiment is Bearish, with RSI at 43.34 (Neutral) and volatility classified as Moderate.
Based on our technical analysis and projected annual growth rate, Virtuals Protocol could reach $0.212109 by 2027. This estimate assumes continued market momentum and adoption trends.
According to our technical analysis indicators, the Virtuals Protocol price prediction is forecasted to reach $0.004285 within the next five years (by 2031). Over the last 30 days, Virtuals Protocol recorded green days 41% of the time.
Based on multiple technical indicators, the current outlook for Virtuals Protocol in 2026 is Bearish. RSI currently sits at 43.34, which indicates Neutral momentum. However, investors should evaluate both technical signals and fundamental developments before making any investment decisions.
Long-term forecasts indicate that Virtuals Protocol may continue to grow over the next decade if adoption, technology development, and global crypto demand continue to expand.
While Virtuals Protocol's future value depends on various factors, technical indicators suggest it could experience both bullish and bearish cycles over time. Long-term investors typically monitor RSI levels, moving averages, and broader market sentiment when evaluating VIRTUAL's future trajectory.
Disclaimer

AMBCrypto's content is meant to be informational in nature and should not be interpreted as investment advice. Trading, buying or selling cryptocurrencies should be considered a high-risk investment and every reader is advised to do their own research before making any decisions.