Recovering from a sluggish pace, Solana has these milestones to watch out for

Solana has been rather sluggish since showering investors with gains of 42% during late-October. An ATH tagged at $219 was countered by profit-taking , forcing bulls to stay vigilant at a support zone of $177-$185. However, a gradual recovery has been underway since.
Now that a descending triangle was negated and the RSI and Awesome Oscillator flashed favorable readings, SOL eyed new goals moving forward. At the time of writing, SOL traded at $210, up by 9% over the last 24 hours.
Solana 4-hour Chart
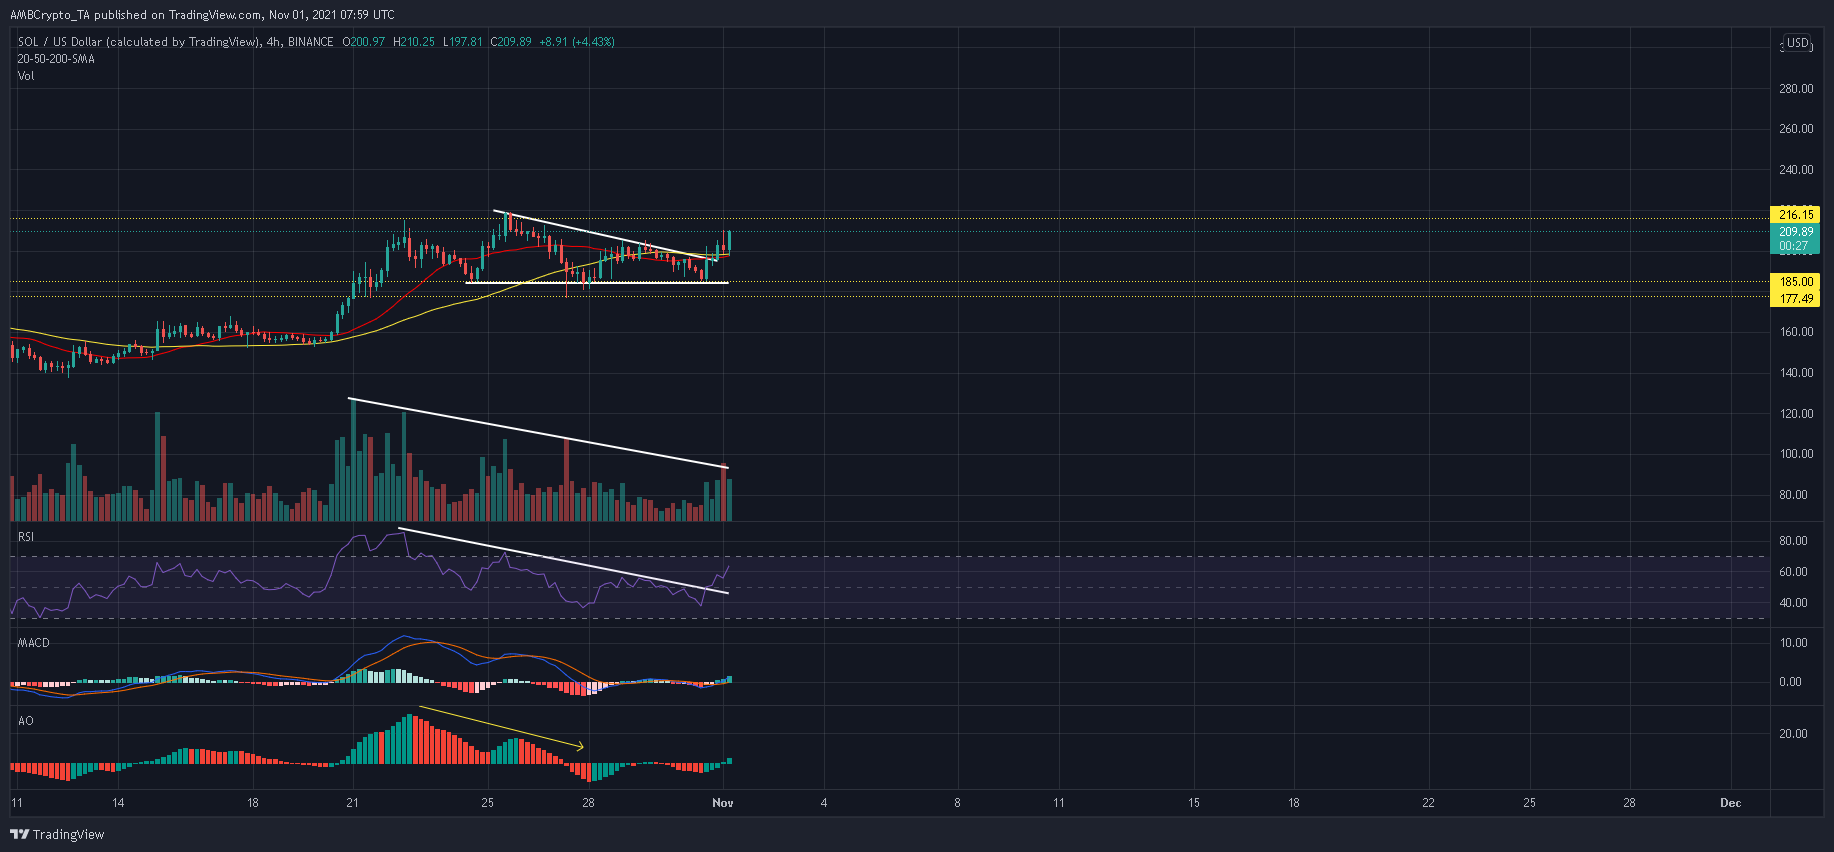
SOL’s descending triangle was a result of several lower highs observed during the past week. Two bearish attacks at the baseline (around $185) were successfully defended as bulls held SOL within the pattern. This bearish setup was finally negated on 31 October, after SOL managed to close above the confluence of its upper trendline and 50-SMA (yellow).
Incidentally, SOL’s 4-hour RSI also invalidated a downwards sloping trendline which ran between 21 to 31 October. The index now traded above 50 and had room for growth towards the upper territory. Optimism was fueled by the Awesome Oscillator as well, which was gradually recovering after a bearish twin peak seen on 25 October.
Should buyers respond to such signals, buy volumes would begin to surge as SOL approaches its earlier ATH. A close above $219 on strong volumes would carve a path to near-term goals at $254.2, $277.8 and $300.
On the flip side, MACD’s indifference around its mid-line was concerning. In case the index weakens below the mid-line, the resultant selling pressure could see SOL halt movement at $216. Such a development could allow for a retest of $177-$185 support.
Conclusion
SOL looked to rejuvenate upwards pressure after shrugging past a descending triangle. Buy volumes were beginning to rise as SOL approached its immediate challenge at $216 price ceiling. Should MACD mirror bullish readings like the RSI and Awesome Oscillator, expect SOL to smash past its immediate price barrier and scale to new milestones.