Solana needs to pause here before it can climb again
Disclaimer: The findings of the following analysis are the sole opinions of the writer and should not be taken as investment advice
2021 has been a phenomenal year for Solana thus far. Its year-to-date ROI stood at a staggering 11,000%, albeit a huge chunk of these gains accumulated during its bull run post July. With healthy metrics backing its price movement, SOL is looking to continue its uptrend heading into November.
Even though its near-term trajectory hit a roadblock at around $216, certain support channels can be expected to aid SOL’s hunt for newer price levels.
At the time of writing, SOL was trading at $208.3, down by 1% over the last 24 hours.
Solana 4-hour Chart
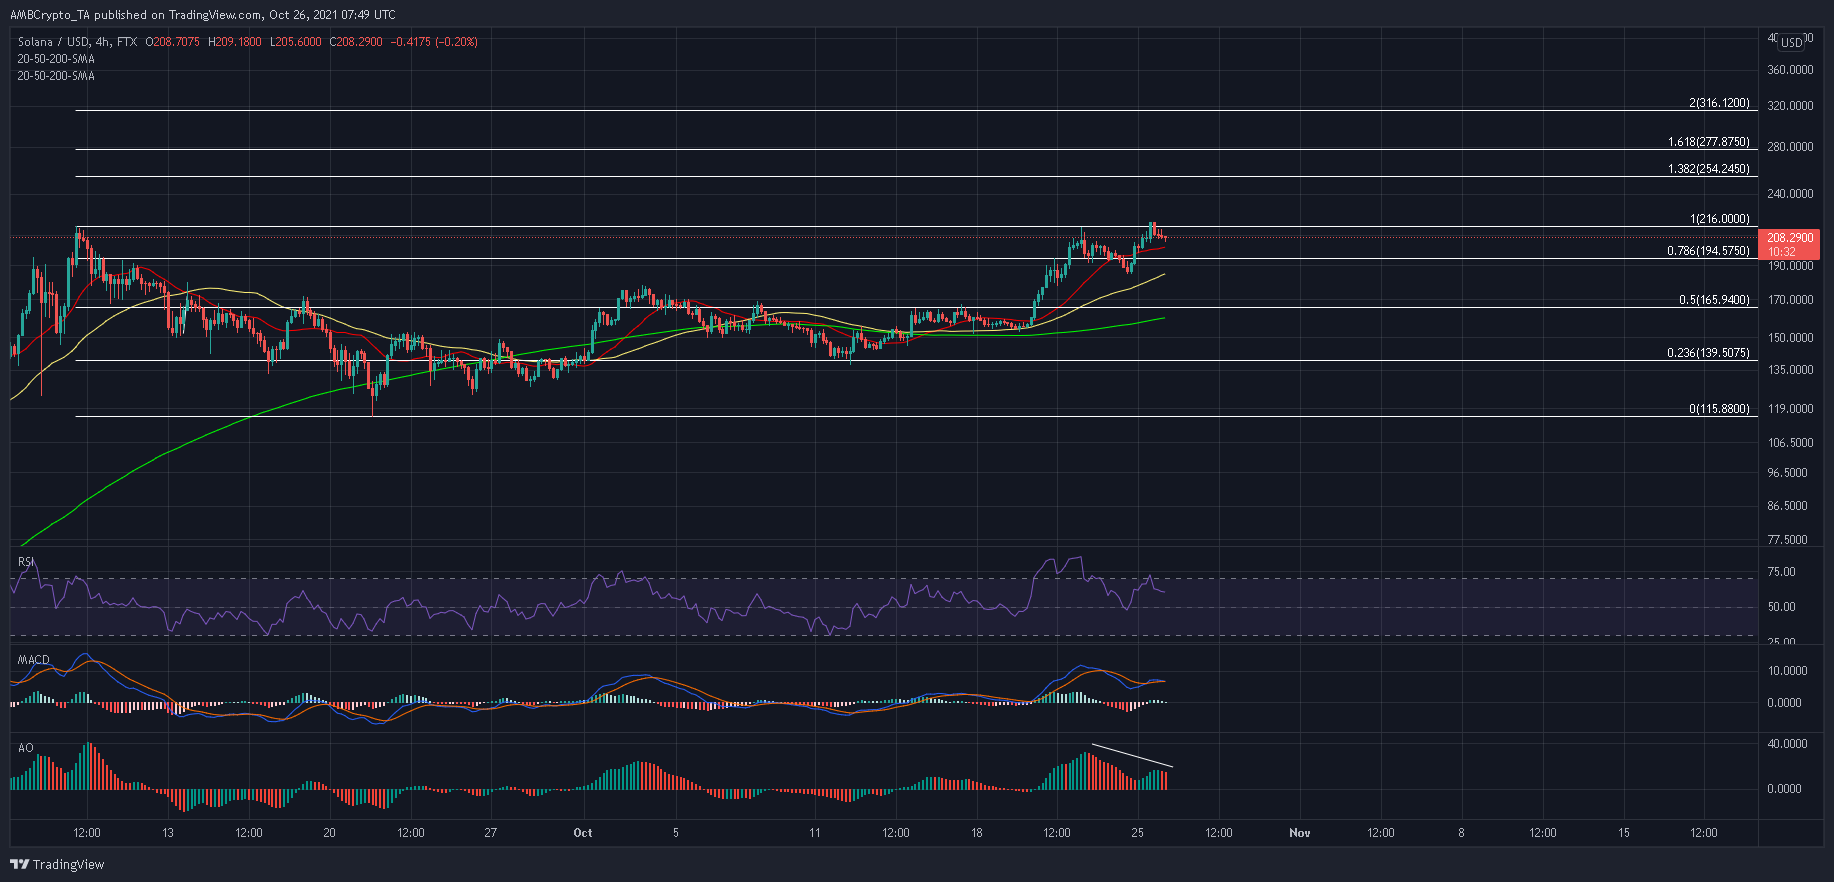
Currently, a double top is preventing SOL from accessing the region above $216. Bearish divergences along the RSI, MACD, and Awesome Oscillator hinted at a potential reversal before SOL clears the blockade above $216. The 78.6% Fibonacci Retracement level and 20-SMA (red) could be key during the anticipated correction as the region would allow SOL to maintain higher peaks post its rally on 20 October.
A double bottom at $185 could also function as a defensive resource, especially since the zone is backed by the 50-SMA (yellow).
A decisive close above $218 would set SOL on course for its 138.2% and 161.8% Fibonacci levels at $254 and $277.8, respectively. To negate this bullish outlook, bears would need to target a close below the 50% Fibonacci level and the 200-SMA (green). Such an outcome would initiate further market drawdowns before bulls can mount a recovery.
Now, the RSI and MACD have eased from monthly highs and seem to be in prime position for the next upwards push. However, a bearish twin peak on the AO is not ideal for those expecting an immediate bounce above $216.
Conclusion
A series of bearish divergences along the RSI, MACD, and AO could see SOL extend losses to its near-term support levels. During the next upwards push, expect SOL to charge towards the 138.2% nd 161.8% Fibonacci levels.


