Render price dips to $5.31 amid market volatility: A closer look
A lack of new catalysts and under-performance relative to its competitors could dampen RENDER’s price trajectory in the coming weeks.
- RENDER price fell sharply on Monday to an intraday low near $5.30.
- The RSI reading on the daily timeframe has ranged above 41 since 21st August.
Bitcoin [BTC] traded slightly higher on Monday, 8th October, climbing to a 24-hour high of $63,957, according to CoinMarketCap data, before reversing course. The flagship cryptocurrency pulled several altcoins alongside it, including Bittensor [TAO] and Sui [SUI], which had racked up double-digit gains at the time of writing.
Memecoins also broadly traded in the green, thriving on a trending, albeit far-fetched, narrative that the memecoin niche will fuel the next crypto market bull cycle.
Meanwhile, Render [RENDER], Kaspa [KAS], and Maker [MKR] stood out among the top losers on the day. Render’s price dropped sharply from $5.66 to a 24-hour low of $5.31 on Monday, bringing the support level around $5.34 into focus.
RENDER’s price struggle at key support
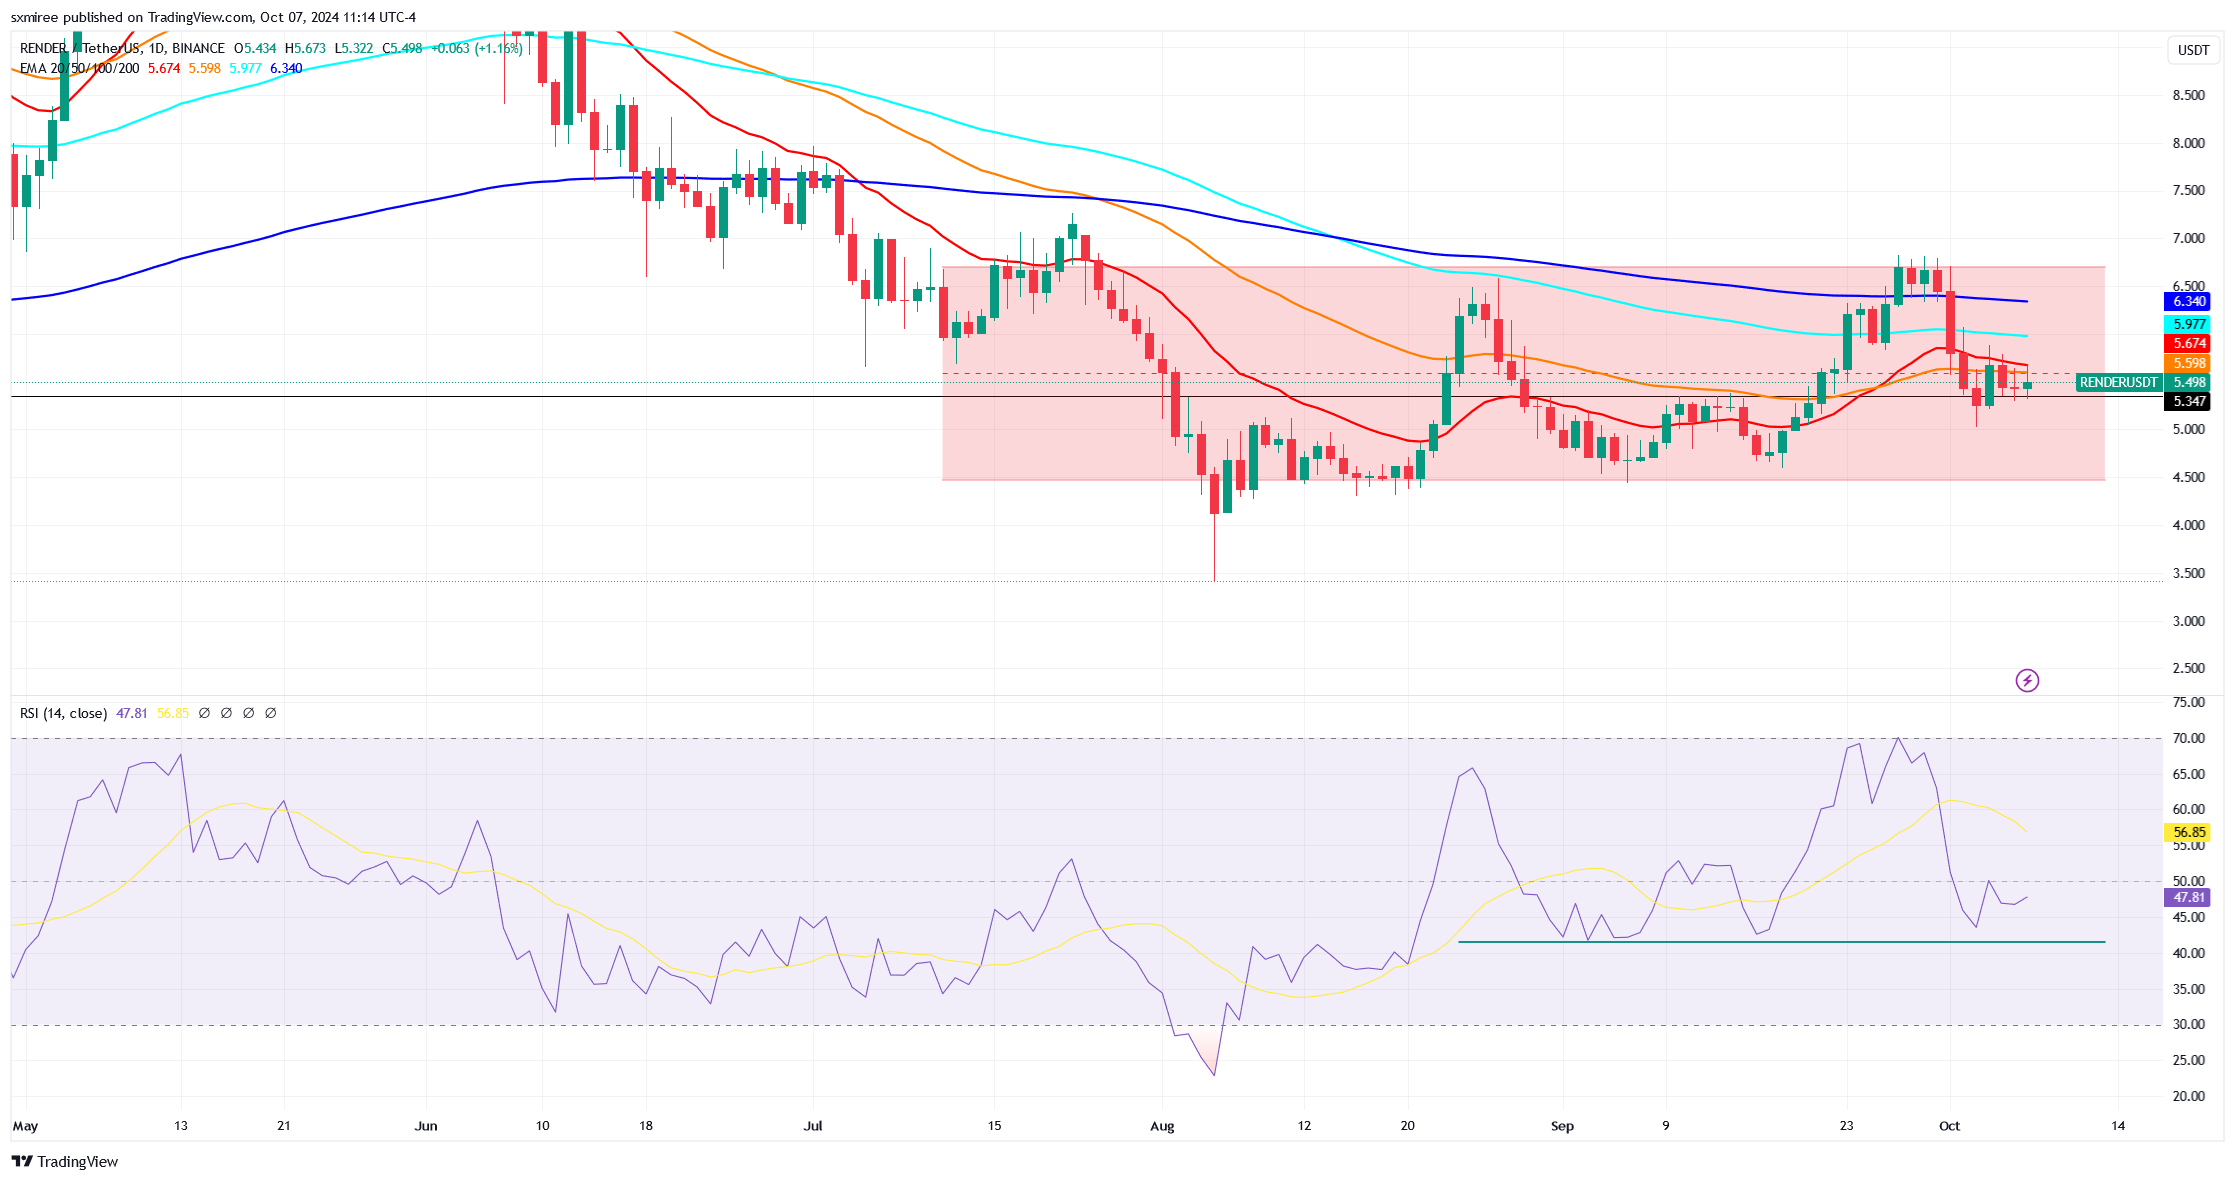
RENDER has shed roughly 17% of its value in the past seven days, trimming its year-to-date gains to 23%. This display highlights a continued struggle in the $4.68 to $6.70 range, where the price has been consolidating for two months.
On TradingView’s 4-hour chart, RENDER/USDT dipped below $5.30 on 3rd October for the first time since September 21 before recovering above the crucial range ahead of the weekend.
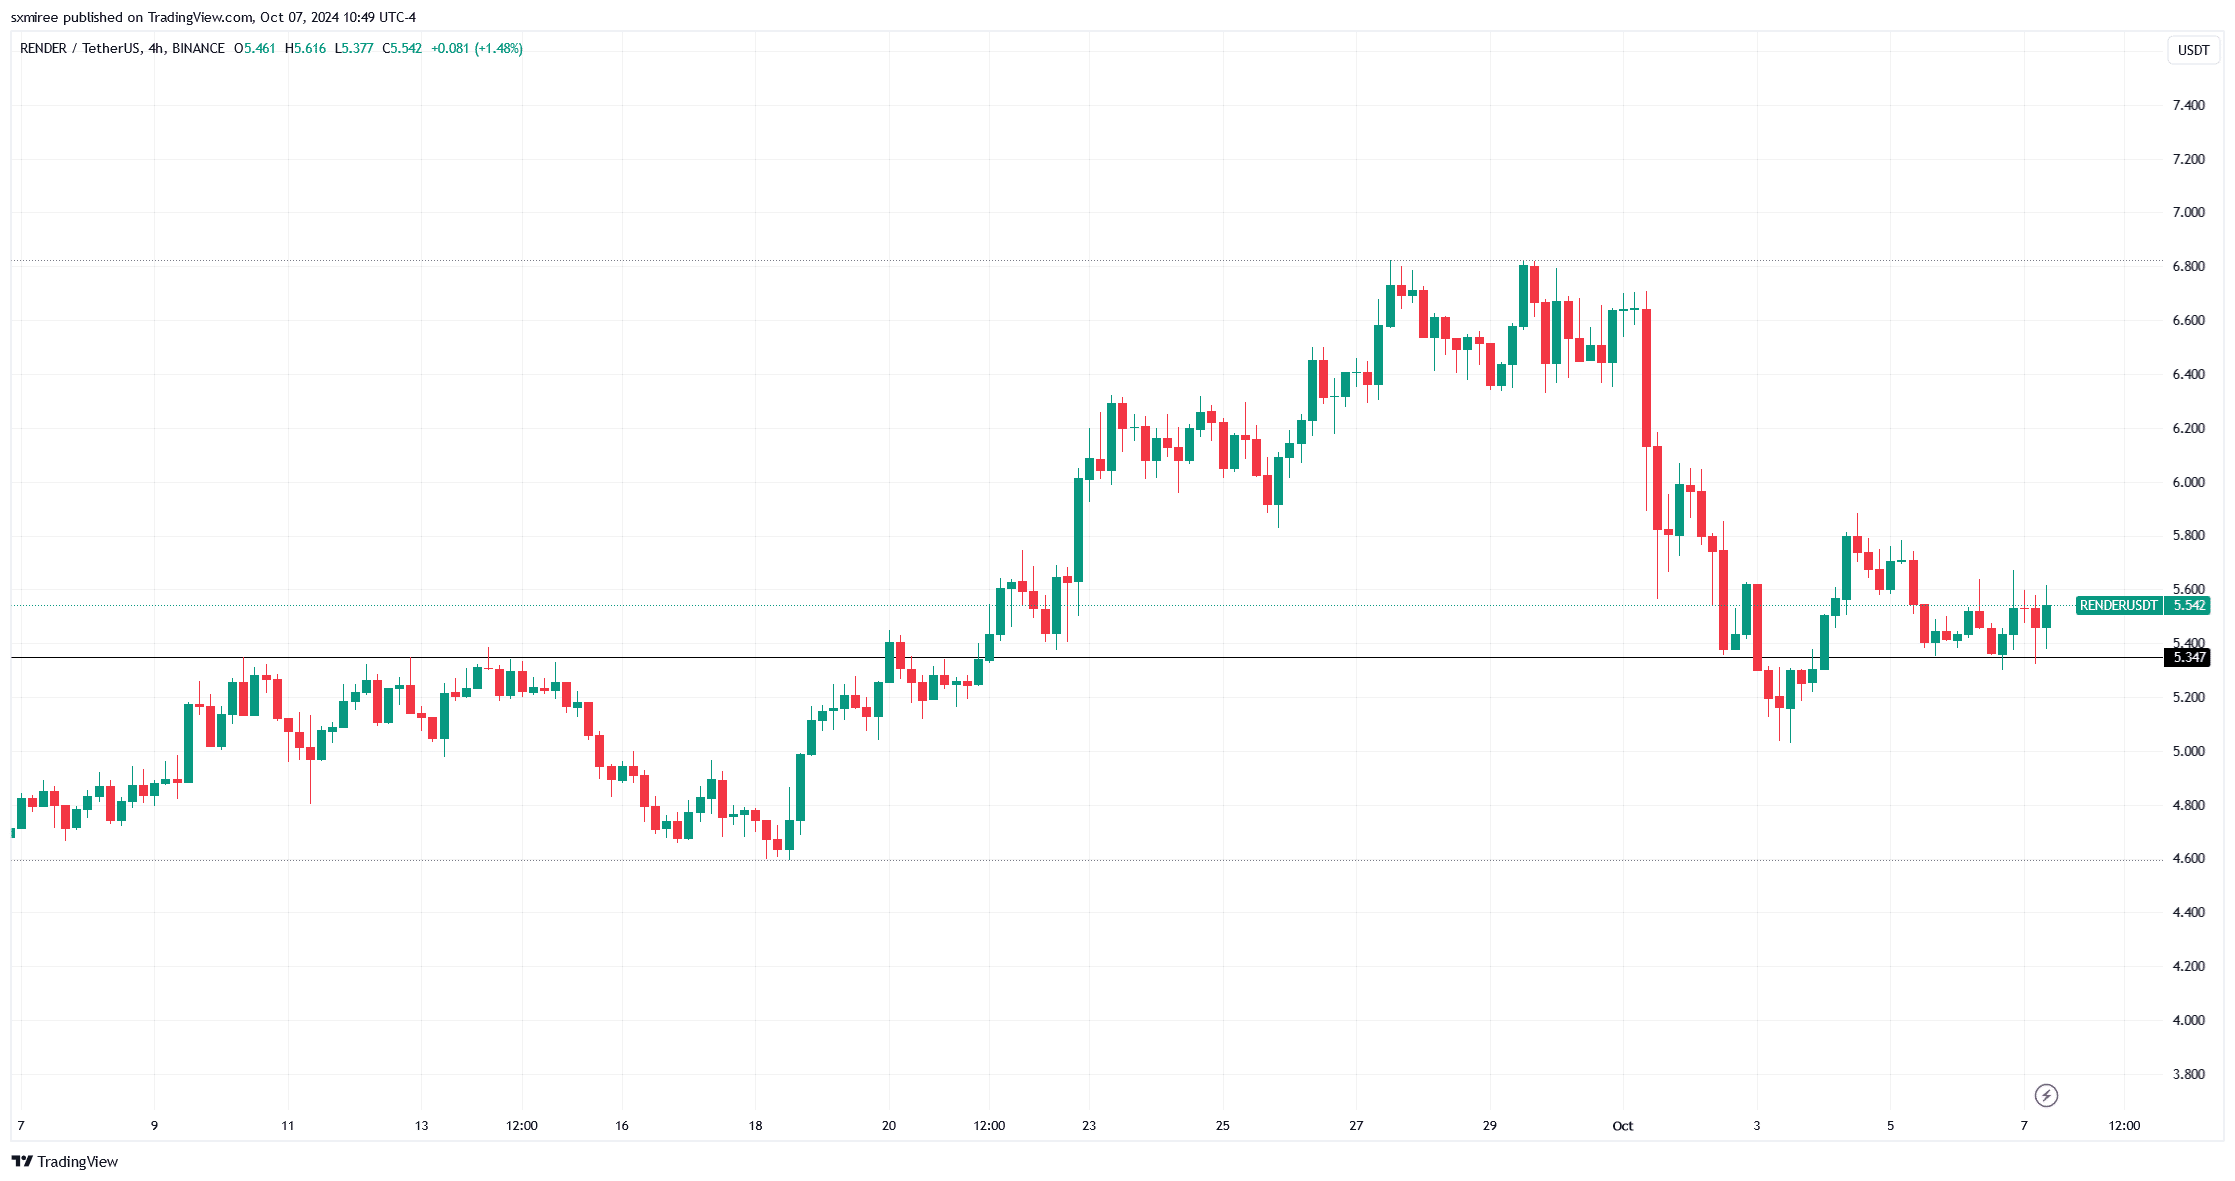
RENDER price retested the $5.40 support again today but had reclaimed higher ground at press time.
This price floor, which coincides with the 50-day Simple Moving Average (SMA) on the daily chart, is significant as it formed a notable resistance for bullish speculators in mid-September.
In particular, RENDER’s price rose to a month high of $6.81 following a successful breakout above the resistance on September 21.
RENDER/USDT technical weaknesses
Messari data shows RENDER has accumulated a trading volume of $2.65 billion in the last 30 days, reflecting an 18.43% increase. The figure is, however, notably lower than that of other AI-related tokens like Bittensor’s TAO, whose trading volume has grown by 170% in the same period.
On the daily chart, RENDER/USDT was trading below its 20, 50, and 100-day exponential moving averages (EMAs), signaling bearish sentiment in the short to medium term.
The daily Relative Strength Index (RSI) reading of 48 is near a neutral range, suggesting that buying support is adequately meeting selling pressure.
Is your portfolio green? Check the Render Profit Calculator
The combination of mildly negative technical indicators, market positioning, and price decline paints a moderately bearish outlook for RENDER in the near term.
Given the lack of immediate catalysts, Render’s price action is poised to be heavily influenced by broader market sentiment.


