Render’s 3-month triangle pattern: A prelude to price breakout?

- Render price remains in a stable range near $5.50 after a period of consolidation and rising whale activity.
- The long-short ratio decline and OI-weighted funding rate indicate potential shifts in market sentiment.
Render [RENDER] price has been consolidating within a symmetrical triangle pattern in the past three months, suggesting indecision in the market.
Throughout this period, a key ascending trendline has respected a strong support, repeatedly tested but never broken.
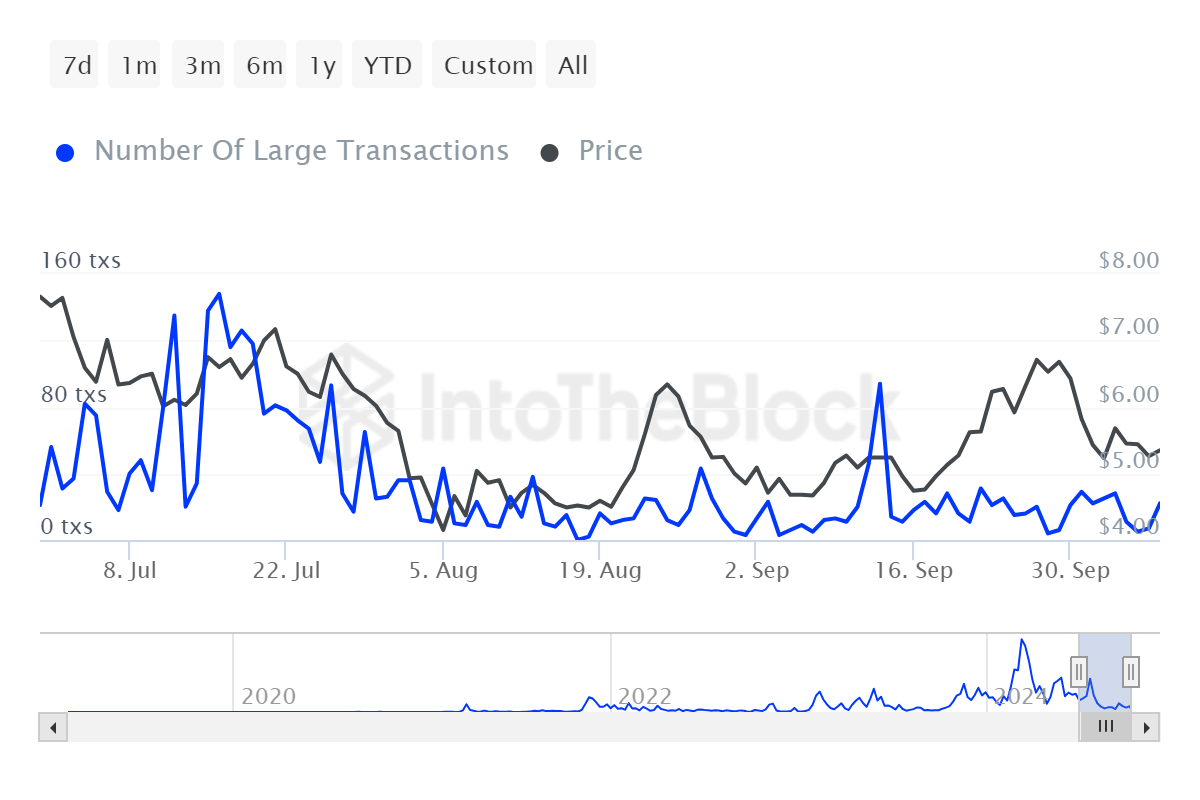
With whale activity surging by 4843%, according to IntoTheBlock, market participants are keenly watching whether this uptick could push the price beyond the current resistance levels.
Source: IntoTheBlock
Render long/short ratio shows market caution
The long-short ratio has continued to decline steadily for the last three days, indicating an increase in short positions in the market. Currently, the ratio stands at 0.9223, signaling bearish sentiments.
This shift could suggest that market participants are wary and further contribute to prices resting below key resistance levels.
Source: Coinglass
Funding rates indicate equilibrium
According to Coinglass data, the OI-Weighted Funding Rate chart for RENDER shows interesting developments from September 2 to October 9.
After a dip to $5.00 in mid-September, the price rebounded and stabilized around $5.50. The funding rate has also remained relatively stable, reflecting a balanced market with fewer fluctuations in market participant positioning.
This equilibrium suggests that both bulls and bears are waiting for a stronger catalyst to break the current range.
Source: Coinglass
Can Render whale activity trigger a breakout?
The confluence of whale activity gains and solid ascending trendline support creates an interesting dynamic on Render.
Is your portfolio green? Check the Render Profit Calculator
On the other hand, a continuously falling long-short ratio and a flatlined funding rate may signal a potential breakout in the near future.
These key metrics—volume, funding rates, and long/short ratio—will be important to watch as an indicator of whether whale interest can save Render from further declines.


