
Polygon’s liquidity strain: Can POL’s support hold as selling rises?

Disclaimer: The information presented does not constitute financial, investment, trading, or other types of advice and is solely the writer’s opinion.
Tron [TRX] has been flying high with its price smashing the year-long resistance level at $0.0711. However, the bullish charge encountered a pullback at the $0.0787 minor resistance level. This led to a 3.9% price drop over the past seven days with the price trading at $0.0748, as of press time.
With Bitcoin [BTC] dropping from $27.3k to $26.9k within the past 24-hour period, it could serve as an opportunity for Tron bears to start a price reversal. Alternatively, this could be just a retracement before a continuation of the upward trend.
Is this the end of the bullish rally?

Source: TRX/USDT on Trading View
Tron’s bullish charge saw the altcoin surge to the minor resistance level of $0.0787. It is important to note that the last time this level was tested was in June 2022 and it ushered in a massive sell wave that took Tron down to a 2022 low of $0.0495. Conversely, the support level at $0.0495 was the foundation for Tron’s bull run in January 2023.
Zooming into the 12-hour timeframe showed significant selling pressure still lay at the $0.0787 resistance level. Price retraced sharply at that level with a long-wick bearish candle. This signified that buyers tried to continue pushing prices upwards, but the selling pressure at that level halted the upward trend.
On-chart indicators highlighted the possibility of a reversal. The Relative Strength Index (RSI) fell out of the overbought zone and dipped under the neutral 50. It stood at 48, as of press time, hinting at increased sell pressure. The Chaikin Money Flow (CMF) also dropped negative with a reading of -0.31. This signaled that the dip resulted from buyers taking profits, hence significant capital outflows.
The trendline showed that Tron was still on an upward trend, despite the pullback. A break of the trend line or resistance level at $0.0711 could signal a shift in momentum from bullish to bearish in the long term. On the other hand, bulls would find support at those levels and push on for more gains.
Read TRON’s [TRX] Price Prediction 2023-24
Decline in Open Interest could stall bullish progress
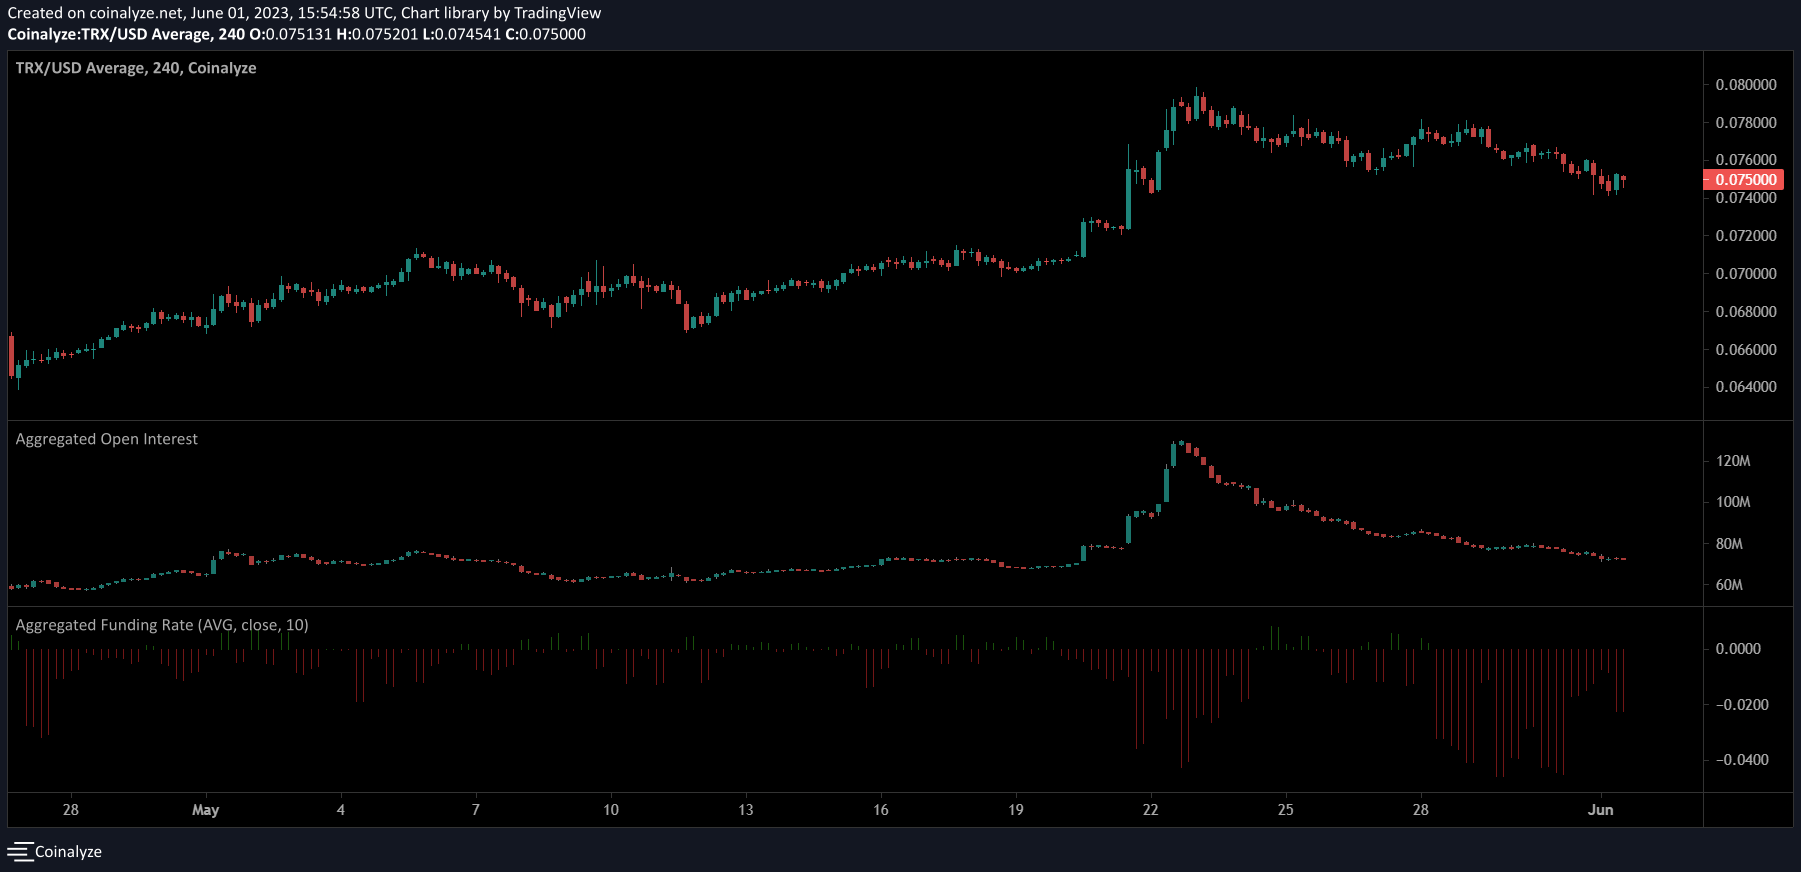
Source: Coinalyze
Data from Coinalyze showed a steady decline in Open Interest upon the retracement from the $0.0787 resistance. The Funding Rate on the four-hour chart was also on the decline since 28 May.
Both sets of data hinted at short-term bearish bias in the market. However, the price action suggested that buying TRX at the $0.0711 price zone could represent a good risk-to-reward trade targeting a retest of the $0.0787 resistance level.


