Risk-averse investors need to watch out for this before buying into MATIC

Disclaimer: The findings of the following analysis are the sole opinions of the writer and should not be considered investment advice
Since late January, Bitcoin Dominance has been on the rise. From 39.4% to 43.58% on the day of writing, this dominance metric meant that capital was flowing out of altcoins and into Bitcoin. Moreover, this metric appeared to be trending upward- which meant that capital flow was likely headed toward Bitcoin from the altcoins. For MATIC, its downtrend on the price charts has been pronounced since its rejection at $2.42.
MATIC- 12H
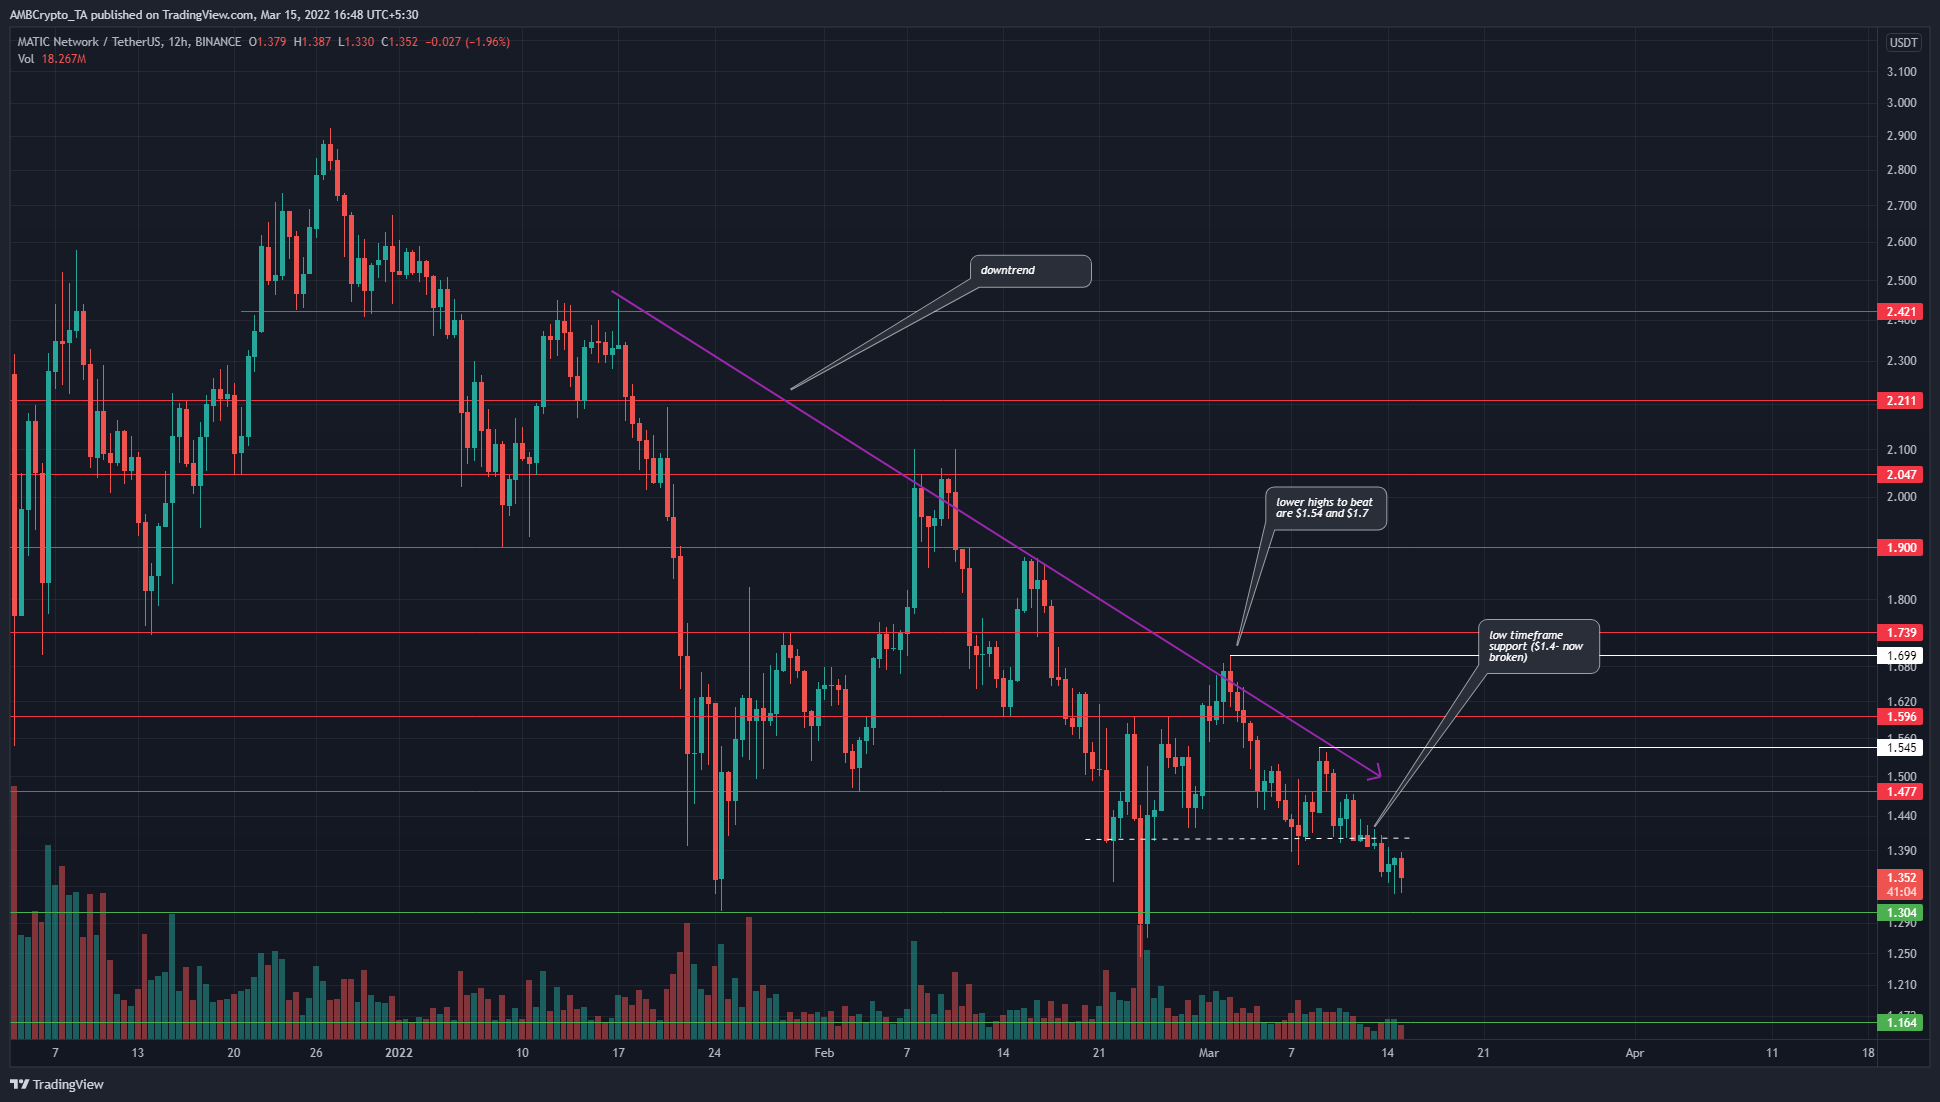
The 12-hour timeframe showed that, despite the strong bounces from the $1.3 and $1.4 support levels in the past three weeks, the overall trend was to the downside. The price set a series of lower highs and has also broken beneath the short-term support level at $1.4 in the past few days.
The $1.25-$1.35 has been a place where long-term investors were interested in buying MATIC in the past. In October, the $1.16-$1.26 area saw strong demand which fueled an uptrend to $2.22 and $2.95 following a retracement.
In a similar manner, the area immediately south could see the trend change for MATIC. Well, that was not the case yet. Hence, risk-averse investors might want to wait to see a trend shift before buying MATIC. More aggressive investors can look to buy at the $1.3 and $1.16 support levels.
Rationale
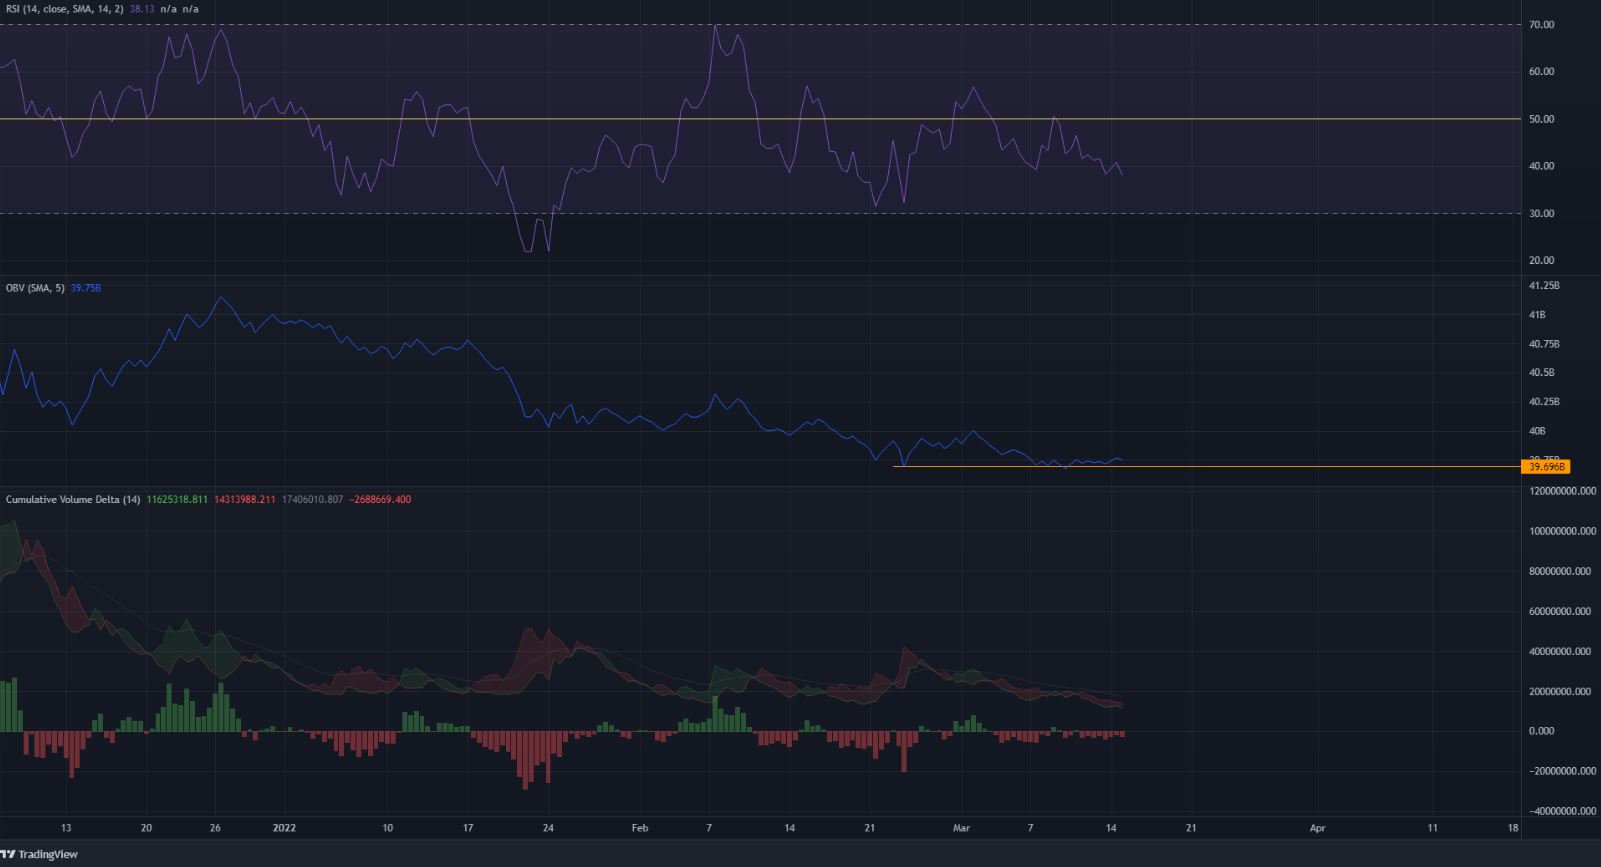
The RSI was at 38.13 and headed lower. The selling pressure has only risen in recent days, as seen when the $1.4 support broke. This could see MATIC and its RSI dive lower down the chart.
Both the CDV and the OBV indicators showed sellers were in the driving seat. The OBV was also on the verge of falling below a recent low. Such a move would reinforce the bearish outlook for MATIC. The CVD has been showing seller strength since mid-February, with a weak rally in early March.
Conclusion
The market structure remained bearish even as MATIC approached a zone of demand. The momentum and selling volume pointed to a further downside according to the indicators. The support levels at $1.3 and $1.16 could see a bounce. However, it was not yet apparent that a shift in trend would materialize. $1.54 remains a powerful local resistance level to beat for the bulls to wrest back control from the sells.
![Bittensor [TAO]](https://ambcrypto.com/wp-content/uploads/2026/07/Gladys-19-e1784100557377.jpg)