Risk-averse investors should do this before taking positions in MATIC

Disclaimer: The findings of the following analysis are the sole opinions of the writer and should not be considered investment advice
The longer-term outlook for Polygon on the charts was not positive. This was something that was common across the altcoin market- only a handful of coins have a bullish outlook on longer timeframes. Away from the charts as well, Polygon has seen trouble in recent hours. The previous day brought with it news that a bug had caused the Polygon network to go down for 11 hours. All user funds were safe and a hotfix was deployed on 11 March.
MATIC- 12H
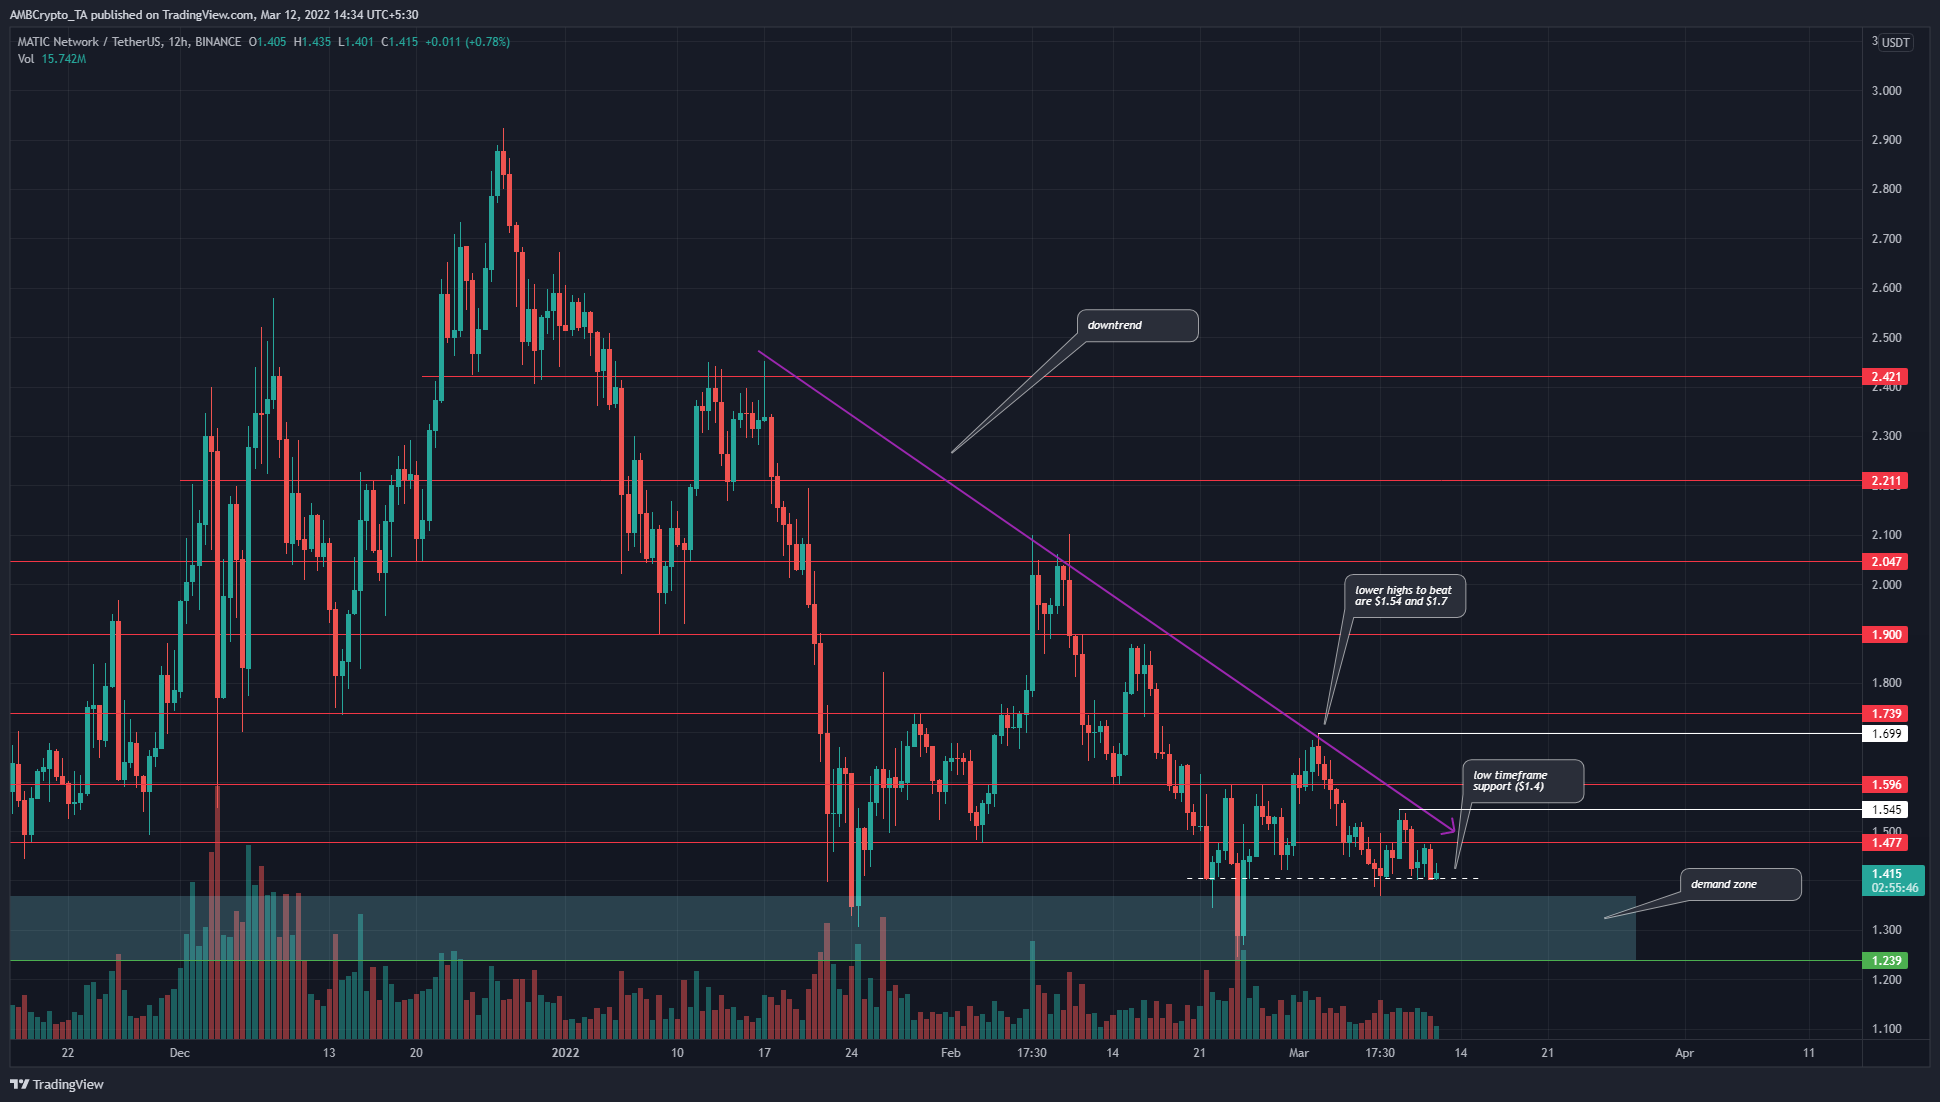
MATIC has been trending downward for the past three months. There has been a strong bounce from the $1.3 area in early February, which sparked a rally as far north as $2.04. However, this was not enough to flip the bias the bullish. Each subsequent revisit of the $1.5 area since then has seen a lower high formed for MATIC.
In particular, the lower highs at $1.54 and $1.7 are the most important levels for the bulls to beat, from a market structure perspective. If MATIC can push past these levels, not even a session close but just a candlewick, it would lend credence to the idea that bulls had some say in the market.
At the same time, the $1.4 level has not had the daily close below it in a couple of weeks now. On the downside, $1.3 offered a potential demand zone.
Rationale
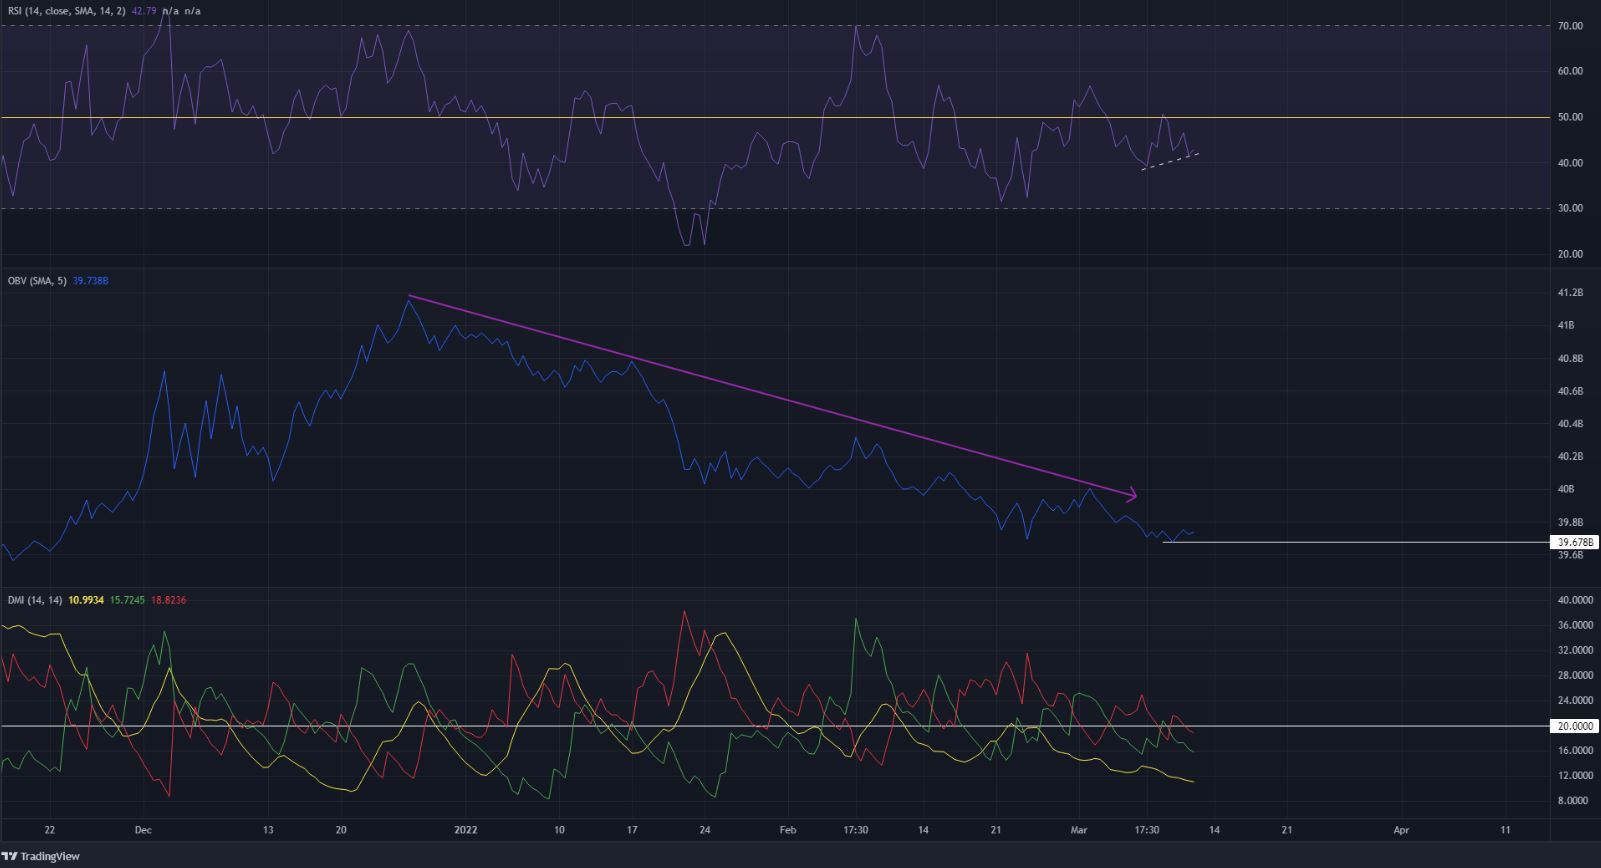
The RSI formed an exaggerated bullish divergence with the price in the past few days. The price formed equal highs while the RSI climbed higher. However, this might only be indicative of a minor move upward.
The OBV has been steadily climbing lower down the charts in recent months, a testament to the selling pressure. The weak bounces from $1.4 recently have meant that the DMI did not show a strong trend yet behind MATIC.
Conclusion
Risk-averse investors might want to wait for a break out of the downtrend before buying MATIC. As things stood, the market structure was bearish. The momentum leaned towards the bears but not heavily so. $1.54 and $1.7 would be levels to watch out for.


