RUNE: A pullback before a resumption of rally seems imminent

Disclaimer: The findings of the following analysis are the sole opinions of the writer and should not be considered investment advice
RUNE has climbed past the $6.56 level and could retest the $6-$6.5 area in search of demand on a bullish run toward $10 in the days or weeks to come. The $5 level was broken in early March, and that move north initiated a short-term rally. However, RUNE bulls have shown the stamina to push higher and past $6.5, which meant the market structure had a bullish bias at press time. A pullback could be a buying opportunity.
RUNE- 1D
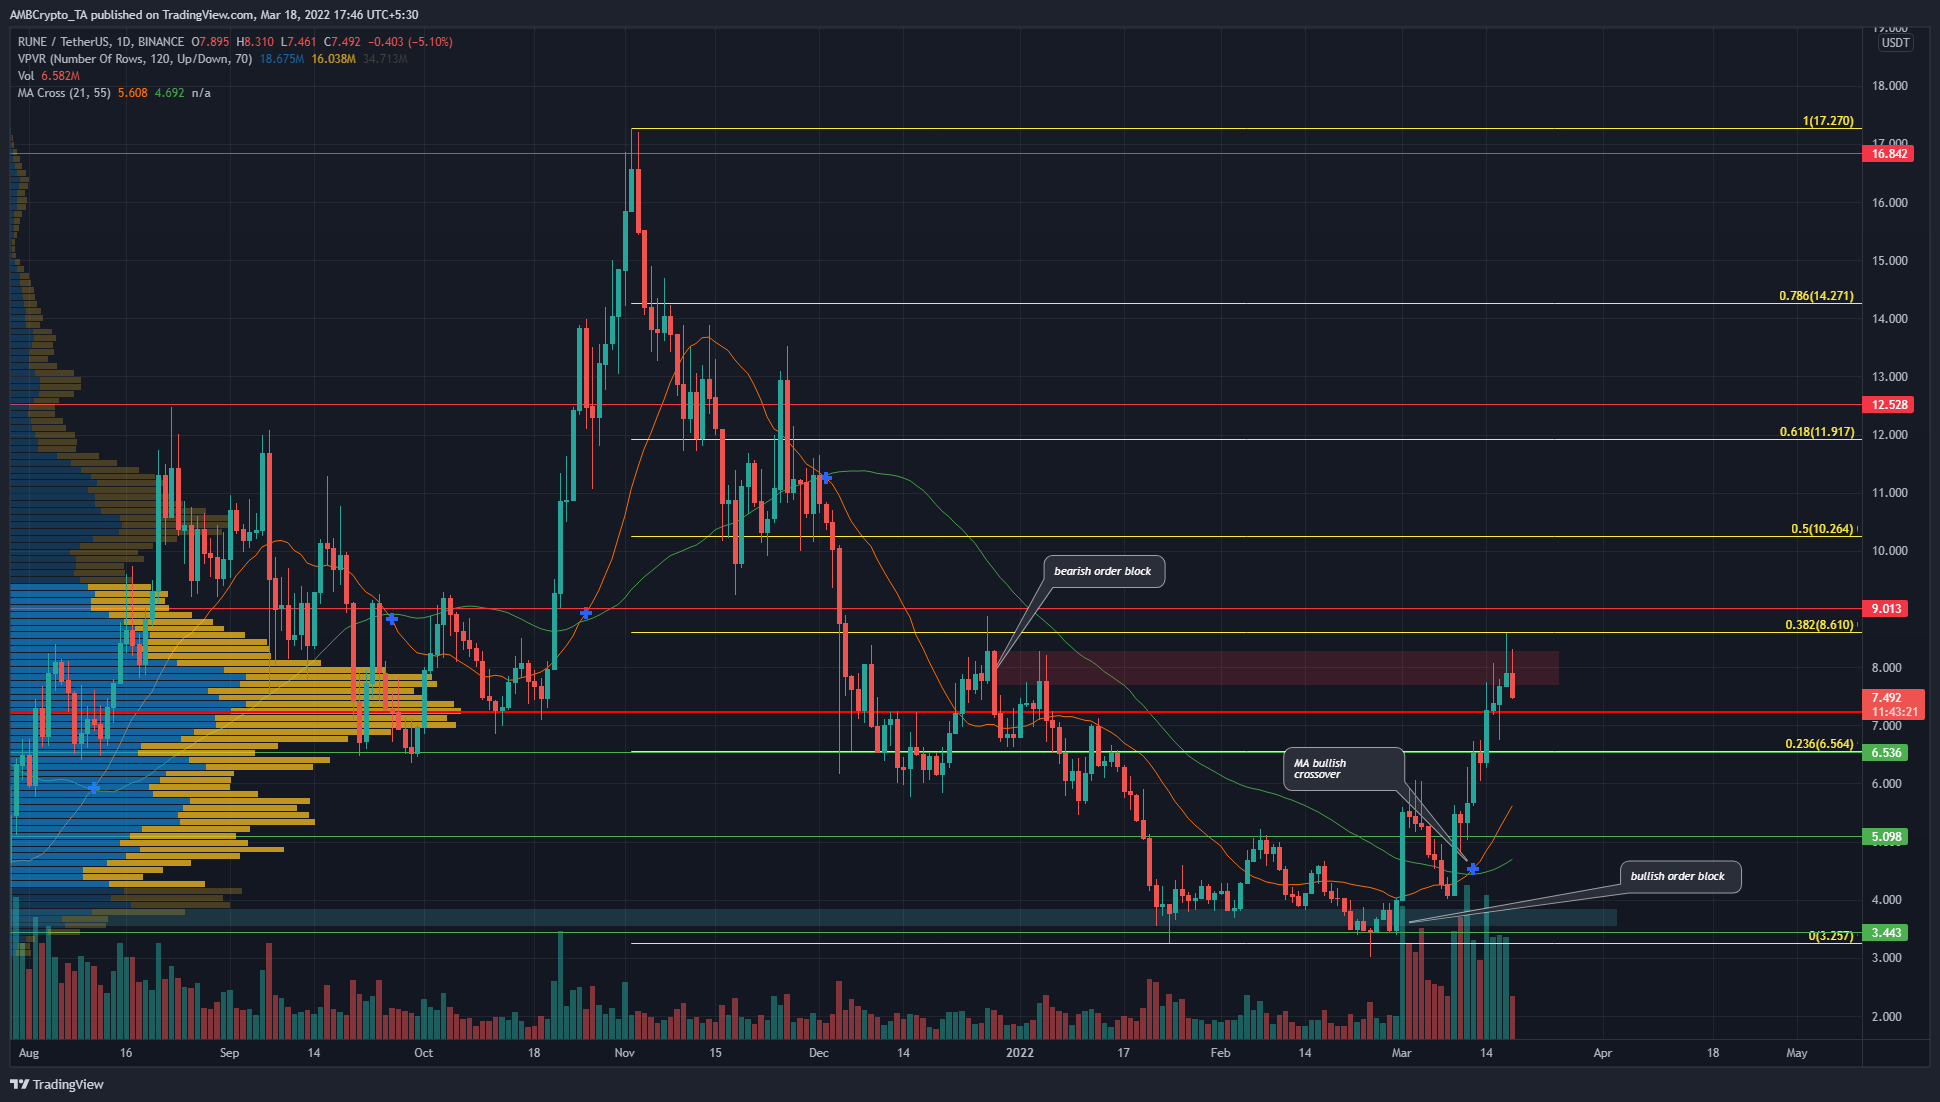
The Volume Profile Visible Range from August to the present day showed that the Point of Control lay at $7.26. At press time, RUNE was trading at $7.49 and had faced rejection at the $8 area. This zone has seen a bearish order block form in recent months.
In mid-December, the daily candle attempted to climb past $8.6 but was rejected, and saw a strong move downward over the next month that reached the lows at $3.5.
Fibonacci retracement levels based on RUNE’s move from $17.27 to $3.25 were plotted (yellow), and at the time of writing RUNE was at an interesting juncture for the bulls. It has tested the $8.61 level as resistance after closing a session above $6.56. Therefore, a retest of the $6-$6.5 area can be used as a buying opportunity.
Rationale
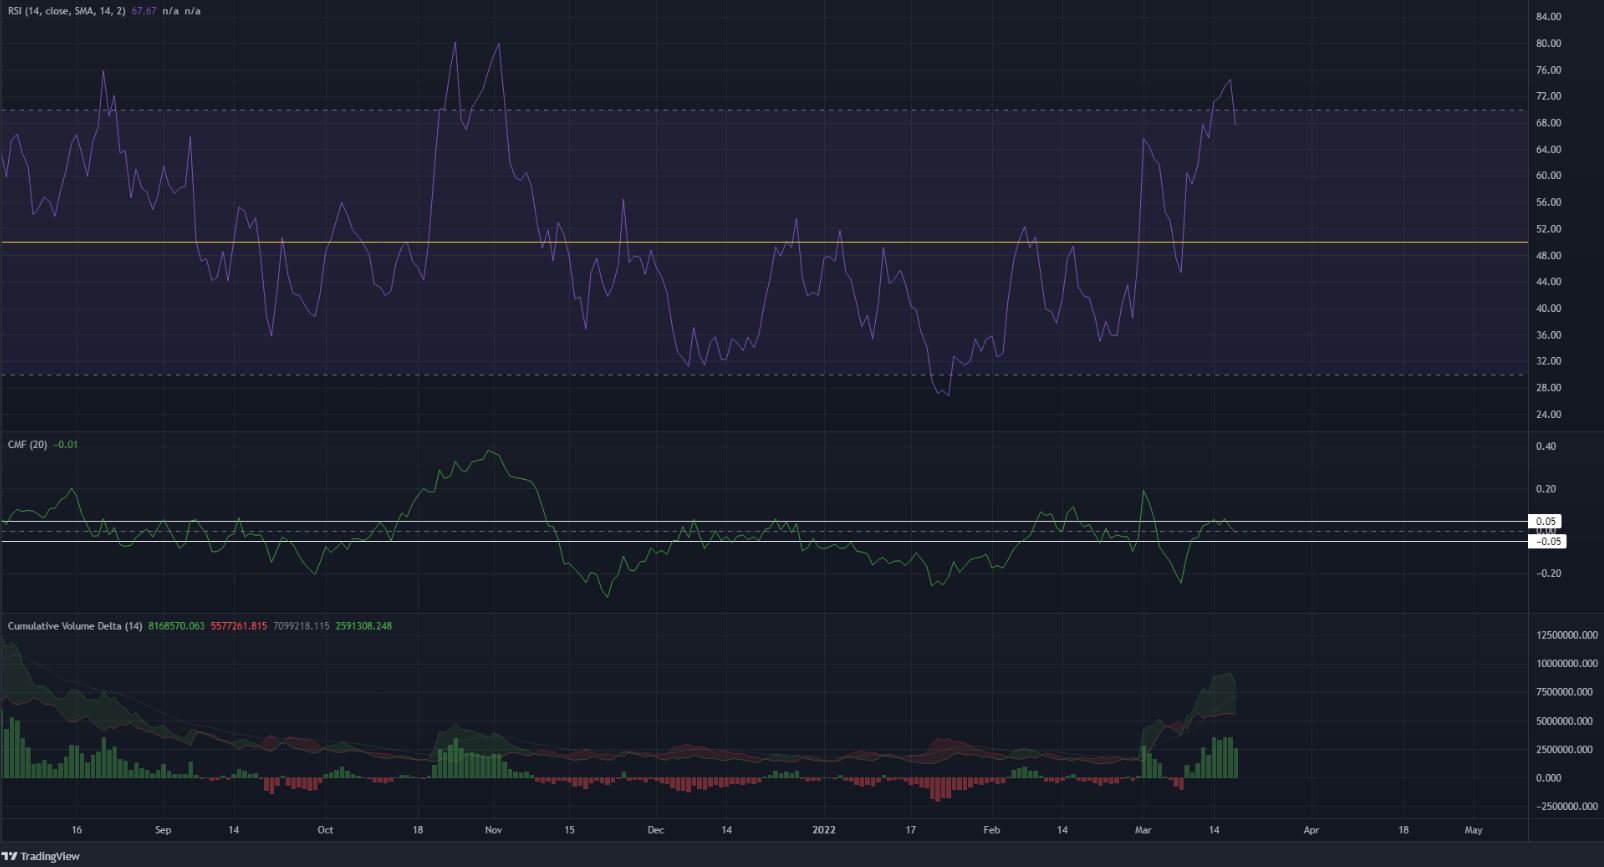
The RSI climbed swiftly into the overbought territory following recent gains. A pullback can not be based simply on the observation that the RSI was in overbought territory, but the confluence of a resistance zone (bearish order block) at $8 and the rejection at 38.6% Fibonacci level lent some credence to the idea of a pullback.
The CMF was in neutral territory after hauling itself from under -0.2- capital flow, which had been heavily directed out of the market, appeared to have changed direction. The CVD also showed large buying pressure in the past week.
Conclusion
Overall, the market structure and the momentum were on the side of the bulls on the longer-term outlook. To the upside, the $10-$10.26 area could offer substantial resistance if $8 is flipped to demand. A pullback to the $6-$6.5 might be seen in the next few days.


