SAND’s descending triangle: What this pattern means for future prices
SAND battled strong resistance at key EMAs, with a breakout above $0.25 needed to spark a recovery and avoid further downside.

- SAND bulls needed to step in decisively to reverse the ongoing bearish momentum.
- Derivates data showed a neutral sentiment with a slight edge for bulls in the near term.
In recent weeks, Sandbox [SAND] continued its bearish movement as the altcoin struggled to break past crucial resistance levels. The price action battled with the 20-day and 50-day EMAs, both acting as strong barriers for bulls.
A long-term trendline (white) further reaffirmed these resistance levels. Since June, the buyers have yet to convincingly breach this resistance. At press time, SAND traded at around $0.25.
SAND bears continued to put more pressure
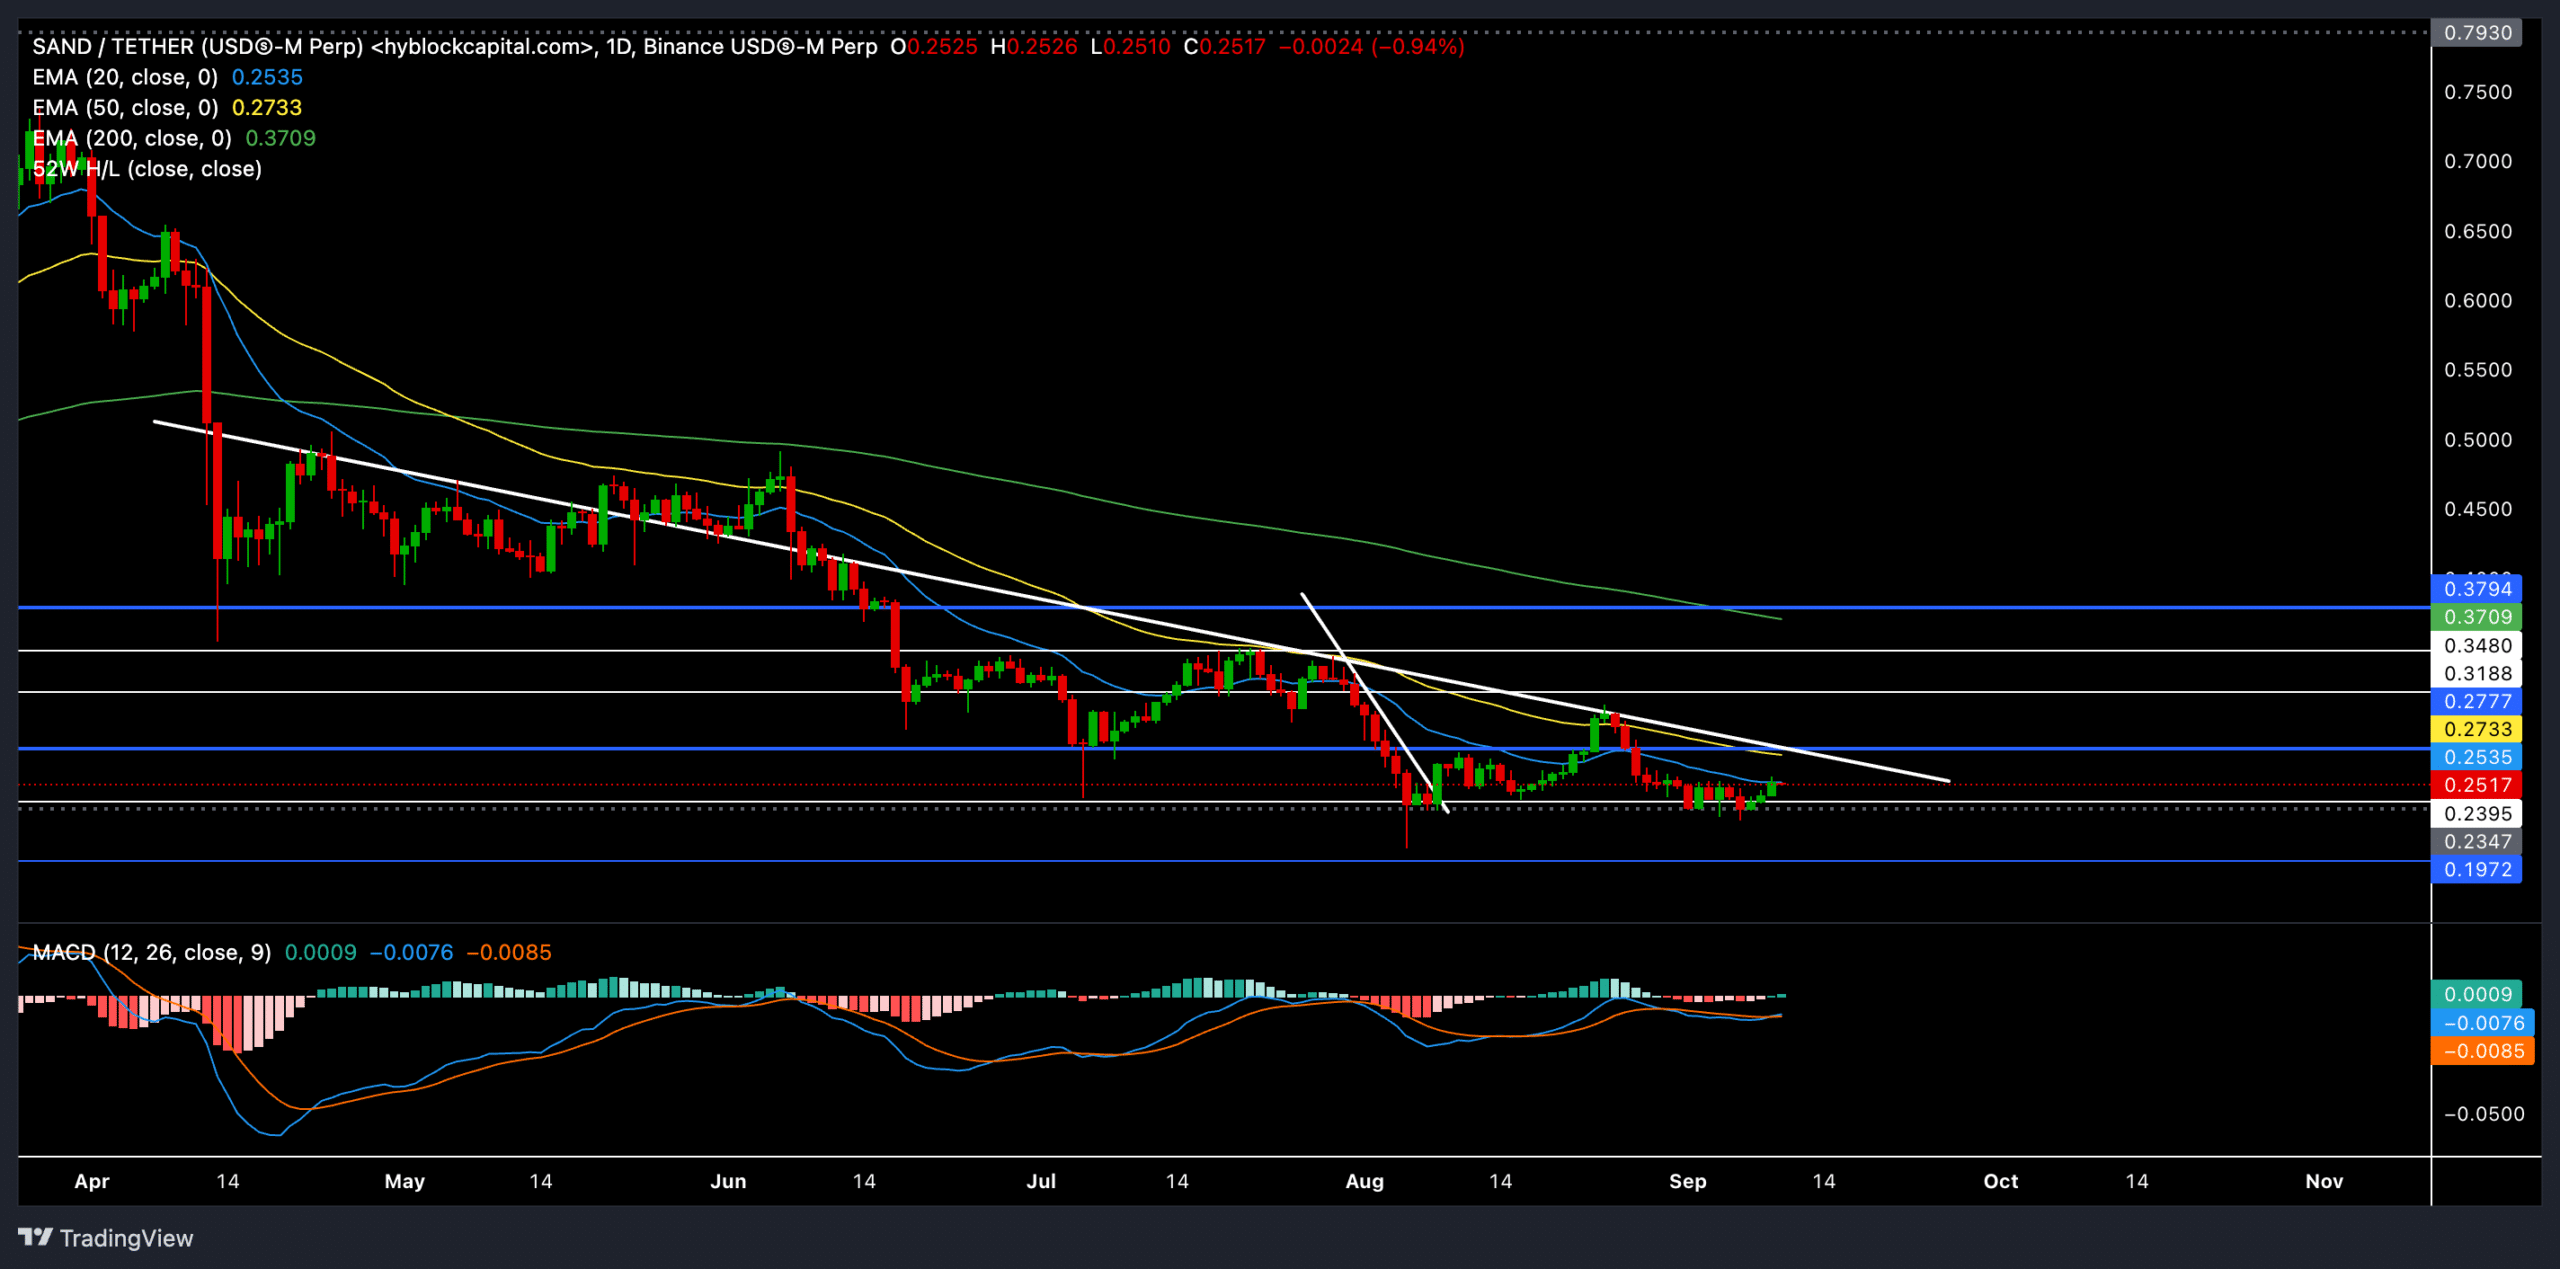
A close look at the price action revealed a descending triangle pattern formation. This pattern is characterized by sellers testing the $0.23 support level multiple times while provoking lower highs on the chart.
This structure typically favors the bears unless the bulls can stage a major breakout above the resistance levels.
The $0.23 support level was a crucial barrier for the bears. A break below this could expose SAND to further downside risks, with the next major support near $0.1972.
On the upside, for buyers to regain momentum, SAND must break and sustain above the 20-day and 50-day EMAs. A close above these EMAs could propel the price toward the $0.3188 resistance level, offering a potential short-term rally.
The MACD indicator continued to reflect a bearish edge. Both the MACD line and the signal line were still below the zero mark, reaffirming the strength of the current downtrend.
However, traders should keep an eye on a potential bullish crossover of these lines, which could signal an ease in selling pressure and provide a window for a bullish reversal.
Derivatives data revealed THIS

According to the latest derivatives data, SAND saw a slight increase in trading volume, up 26.18% to $39.52 million. Despite this, open interest dropped by 1.27%, showing a cautious sentiment.
The long/short ratio across major exchanges showed mixed signals. On Binance, the ratio was heavily skewed towards long positions at 2.2 (top trader accounts). On OKX, it was at a more conservative 1.44. The market’s overall long/short ratio was near-neutral at 1.004.
SAND’s future trajectory will depend heavily on its ability to break above the 20-day and 50-day EMAs and long-term trendline resistance. A successful close above these levels could ignite a recovery towards $0.28 and higher.
Realistic or not, here’s SAND market cap in BTC’s terms
However, failure to maintain the $0.23 support could push SAND into a deeper decline toward $0.19.
Traders should monitor the MACD for early signs of a bullish crossover and derivatives data for shifts in long/short positions.