Secret crypto (SCRT) price prediction – What next after its 200% price rally?
Secret's rally faces major resistance - Will bulls sustain momentum or is a deeper pullback looming?
- After noting a triple-digit surge in just two days, Secret saw a slight downturn from the $0.42 resistance
- A golden cross on the daily chart could trigger a long-term bullish trend
Secret (SCRT) registered an over 200% two-week-long rally from a series of green candles from 5 to 17 November.
The altcoin breached the crucial $0.23 resistance, which acted as a ceiling for almost three months. However, the buying momentum faced its first major hurdle as SCRT struggled to close above the $0.35-mark after briefly testing a seven-month high.
At press time, SCRT was trading at $0.34, down by over 32% in the last 24 hours, depicting a declining bullish edge.
Can SCRT buyers sustain the momentum?
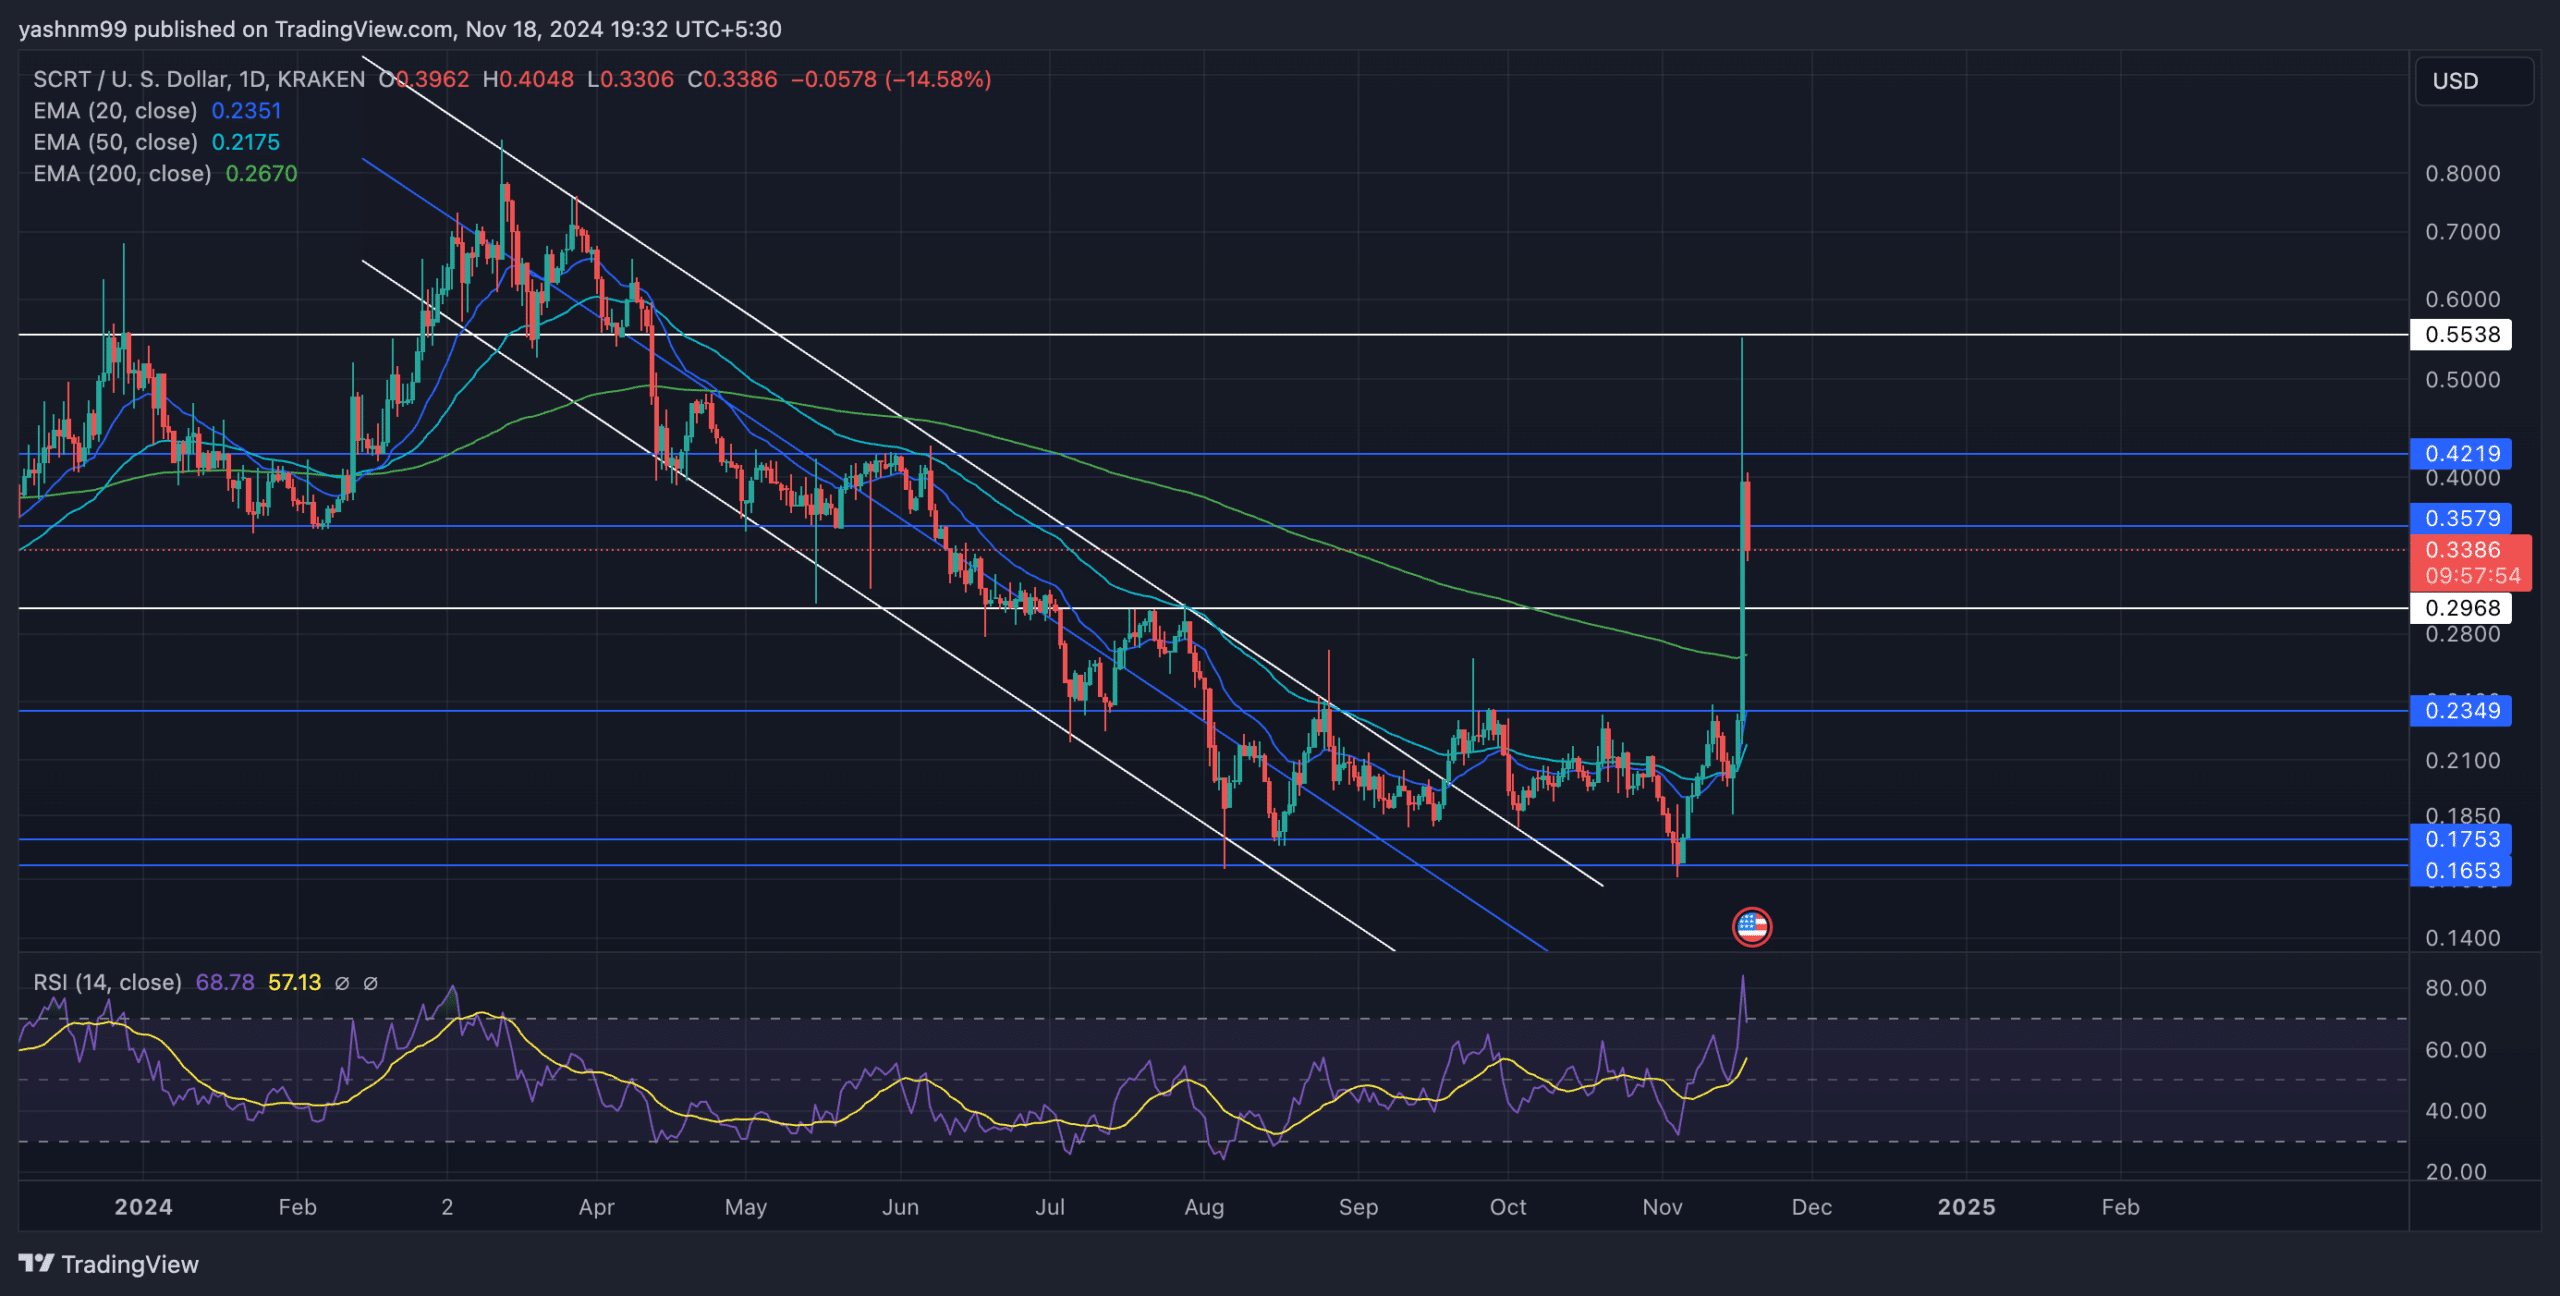
The altcoin’s latest price action highlighted the importance of the EMA levels in gauging SCRT’s near-term trajectory. At press time, SCRT was hovering above its 20-day, 50-day, and 200-day EMAs to project a strong bullish trend. However, the $0.42 resistance provoked a near-term downtrend on the charts.
Should SCRT close above the $0.357 resistance (near the 200-day EMA), it could set the stage for testing the $0.42-$0.55 range. The golden cross of the 20-day EMA above the 200-day EMA could add more fuel to a bullish revival.
Conversely, a breakdown below $0.29 could signal the end of the bullish uptrend and push the price back towards the $0.23 support. This might potentially lead to further consolidation in the long term. The near-term EMA levels can be considered crucial support clusters that buyers must defend to prevent a deeper pullback.
The RSI (Relative Strength Index) recently touched 83 before falling back to 68 – A sign of bullish momentum cooling off after going to overbought levels. While the RSI’s moving average was still above the 50-mark, buyers could continue to have a slight edge in the market.
SCRT Derivatives data analysis

The volume surged by over 217.34% alongside the 24-hour losses, indicating a strong bearish move over the past 24 hours. However, the Open Interest fell sharply by 28.93%, signaling that many traders may have closed positions amid the high volatility.
The 24-hour long/short ratio was relatively neutral at 0.9631, indicating no clear advantage between the bulls and the bears. However, Binance’s SCRT/USDT ratio showed a more bullish sentiment at 1.2, with top traders positioning themselves optimistically.
Traders should keep an eye on the RSI and derivatives data for early signals on the next move. A rebound from $0.29 could lead to another rally towards $0.42, while a breakdown below $0.29 might call for a shift towards defensive trading strategies.