SHIB could see a 3.5% bounce despite intense selling pressure. Here’s why…
Hyblock data noted the Cumulative Liq Levels Delta was heavily bearish, amounting to $55 million. The inference was that a bounce could wipe out a lot of short positions

Disclaimer: The information presented does not constitute financial, investment, trading, or other types of advice and is solely the writer’s opinion.
- SHIB has a bearish structure and significant capital outflow.
- Despite the technical indicators, the possibility of a short-term range formation persists.
Shiba Inu [SHIB] bulls attempted a breakout on Monday (16 October) past its short-term bearish structure but were unable to force a rally. The Fibonacci retracement levels held firm, despite Monday’s volatility. Now, SHIB was trading at the local lows once again.
Read Shiba Inu’s [SHIB] Price Prediction 2023-24
The most recent analysis piece on Shiba Inu by AMBCrypto highlighted a critical resistance on the charts at $0.000007. This level was briefly flipped to support on Monday, 16 October, but the bulls were unable to hold on.
The volume indicators showed firm selling pressure behind Shiba Inu
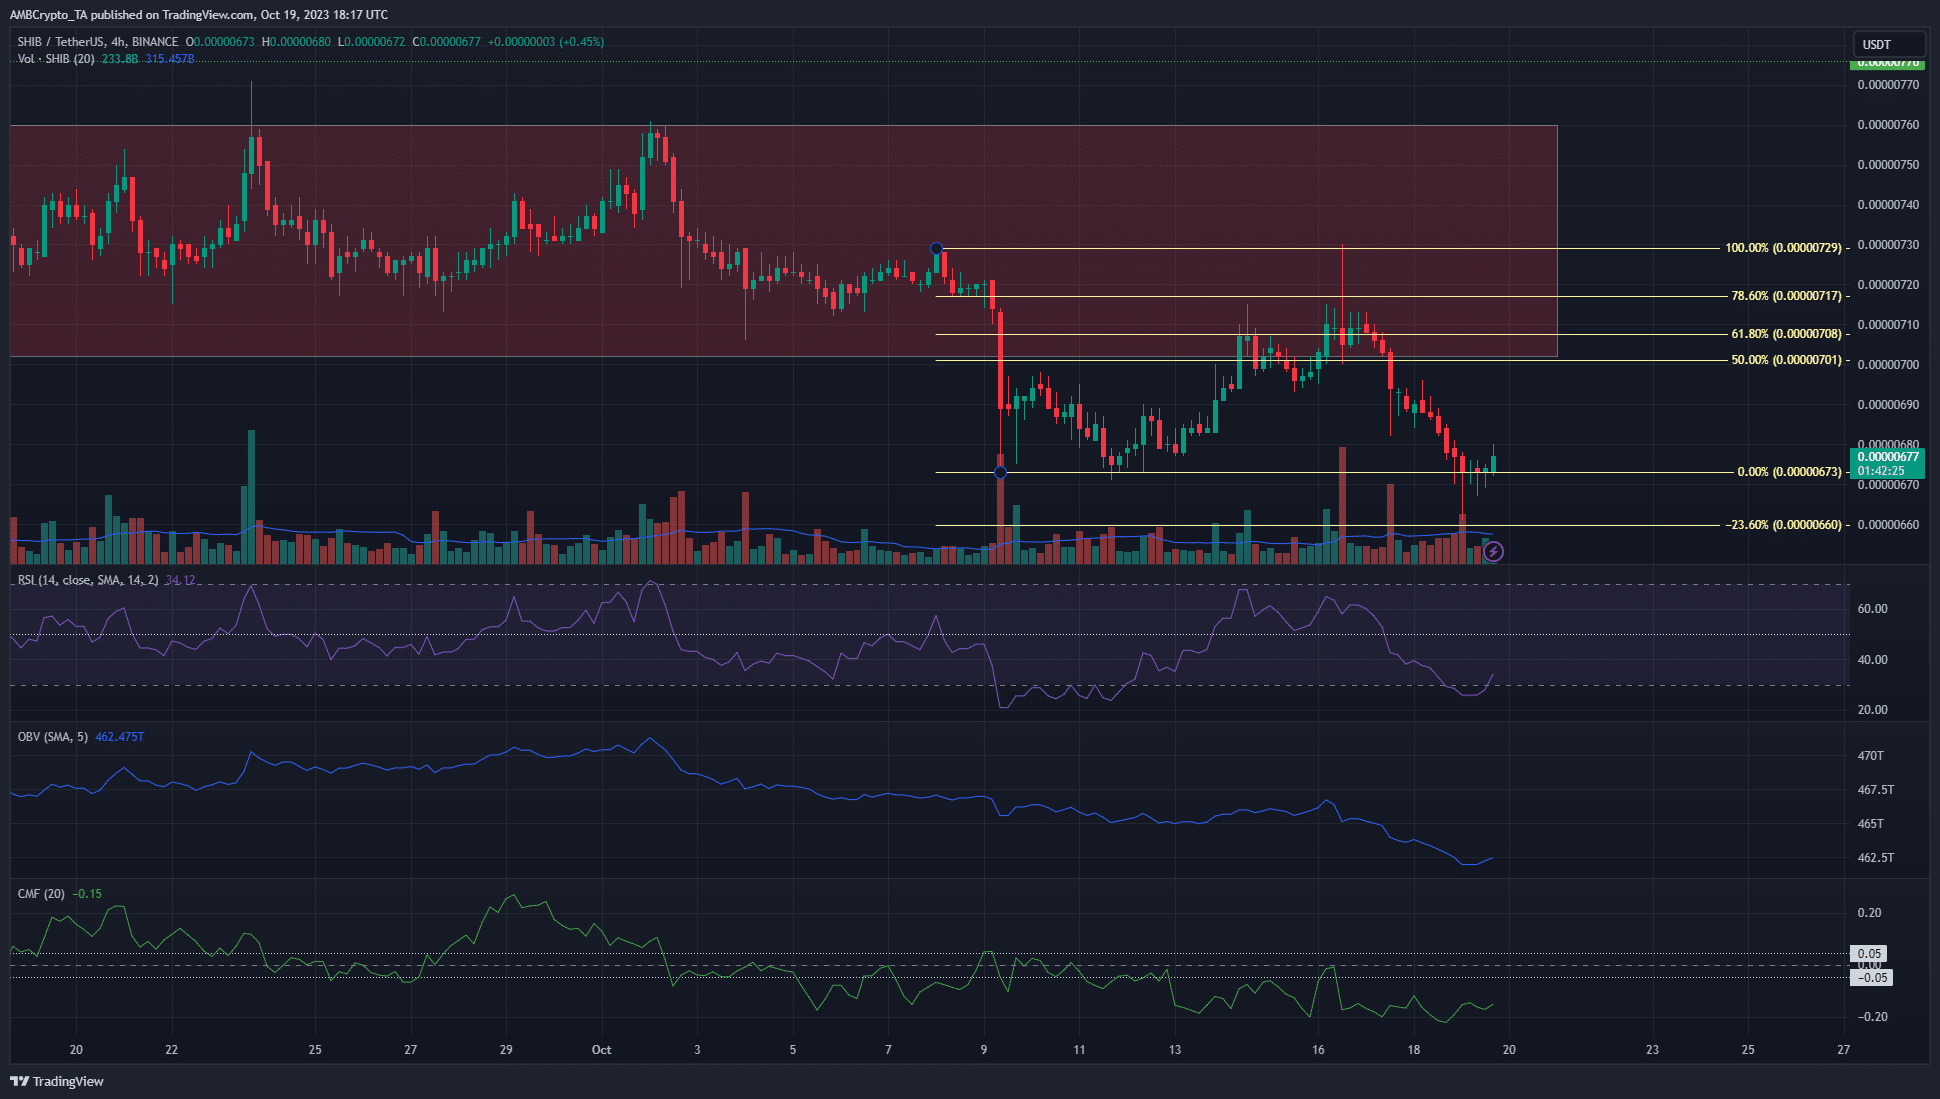
On the four-hour chart, the market structure of SHIB was flipped bearishly after the fall below $0.00000693. It sank to the local lows at $0.00000673. The previous such drop occurred on 9 October, and a set of Fibonacci levels (pale yellow) were plotted.
The 61.8% and 78.6% levels did not see an H4 trading session close above it, even though there was a momentary spike to the $0.00000729 level. Over the past 12 hours, SHIB bulls have managed to halt the bearish march. This suggested that there was a chance of a bounce toward the $0.000007 level again. Invalidation of this idea would be a drop below the $0.00000666 level.
However, the technical indicators reflected bearishness. It must be noted that the Relative Strength Index (RSI) and Chaikin Money Flow (CMF) are lagging by nature, but both showed hefty bearish momentum and significant capital outflow. The On-Balance Volume (OBV) has also trended lower over the past two weeks.
Liquidation levels chart supported the idea of a minor bounce

Data from Hyblock noted the Cumulative Liq Levels Delta was heavily bearish, amounting to $55 million. The inference was that a bounce could wipe out a lot of short positions that arrived late or haven’t yet booked profits.
Realistic or not, here’s SHIB’s market cap in BTC’s terms
To the north, the $0.00000689 and $0.000007 levels would result in close to $5 million in short liquidations each. Additionally, another pocket of $2.3 million of short liquidations was at $0.00000711, making these levels attractive targets for short-term bulls to take profits at.