Analysis
SHIB hits bullish breakout target of $0.00001155 – Can bulls push forward
Disclaimer: The information presented does not constitute financial, investment, trading, or other types of advice and is solely the writer’s opinion
- Bulls faced stiff resistance at a bullish breakout target of $0.00001155.
- SHIB was bullish on the four-hour chart, but RSI hit the overbought zone.
Shiba Inu [SHIB] broke above its descending triangle pattern and hit the bullish breakout target of $0.00001155 – appreciating by 10%. But the level has been a stiff resistance afterwards, setting SHIB to oscillate within a key range on the four-hour chart.
Read Shiba Inu’s [SHIB] Price Prediction 2023-24
At press time, Bitcoin [BTC] consolidated between $26.87k and $28.52k, showing bulls were still hopeful of pushing forward. A bullish BTC could tip SHIB to attempt to clear its overhead resistance.
Can bulls clear the $0.00001155 resistance level?
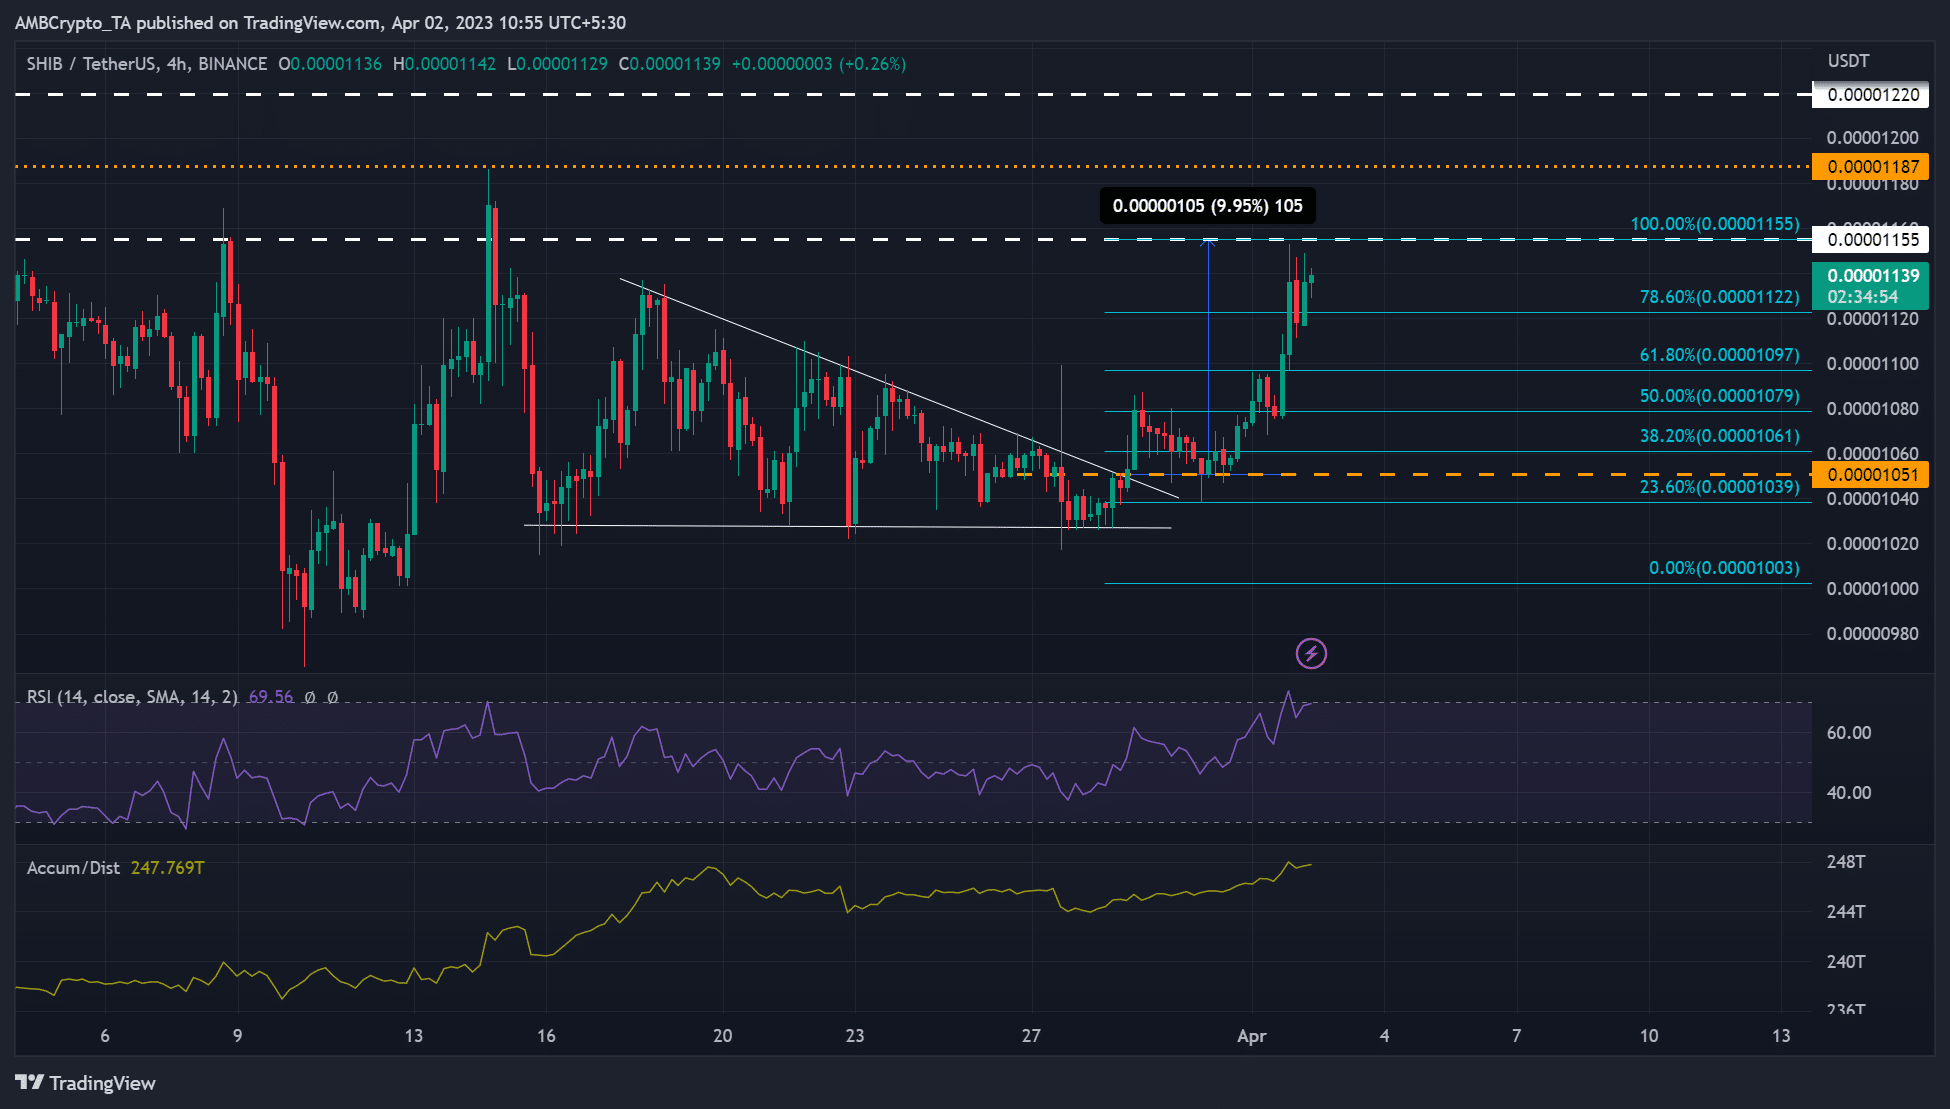
Source: SHIB/USDT on TradingView
SHIB’s price action made the same lows with corresponding lower highs from mid-March, curving up a descending triangle pattern. It broke above the pattern and hit the target of $0.00001155 after a pullback retest on $0.00001051. At press time, the price oscillated between 61.8% Fib level ($0.00001097) and 100% Fib level ($0.00001155).
SHIB could oscillate between the above range, so long as BTC maintains its consolidation range, too. As such, investors could target the upper ($0.00001155) and lower ($0.00001097) range boundaries. But they must watch out for the 76.8% Fib level ($0.00001122) whenever targeting the above range levels.
A bullish BTC could push SHIB to clear the overhead resistance level of $0.00001155. The next likely targets for SHIB bulls in such an upswing are $0.00001187 and $0.00001220. But a close below 61.8% Fib level ($0.00001097) could attract more selling pressure, but the 50% or 38.2% Fib levels could slow the price dump.
At press time, the RSI was bullish, but it hit the overbought zone, which makes SHIB ripe for likely price reversal in the short term. But, the Accumulation/Distribution indicator surged, indicating increased buying pressure.
The Mean Coin Age slope rose
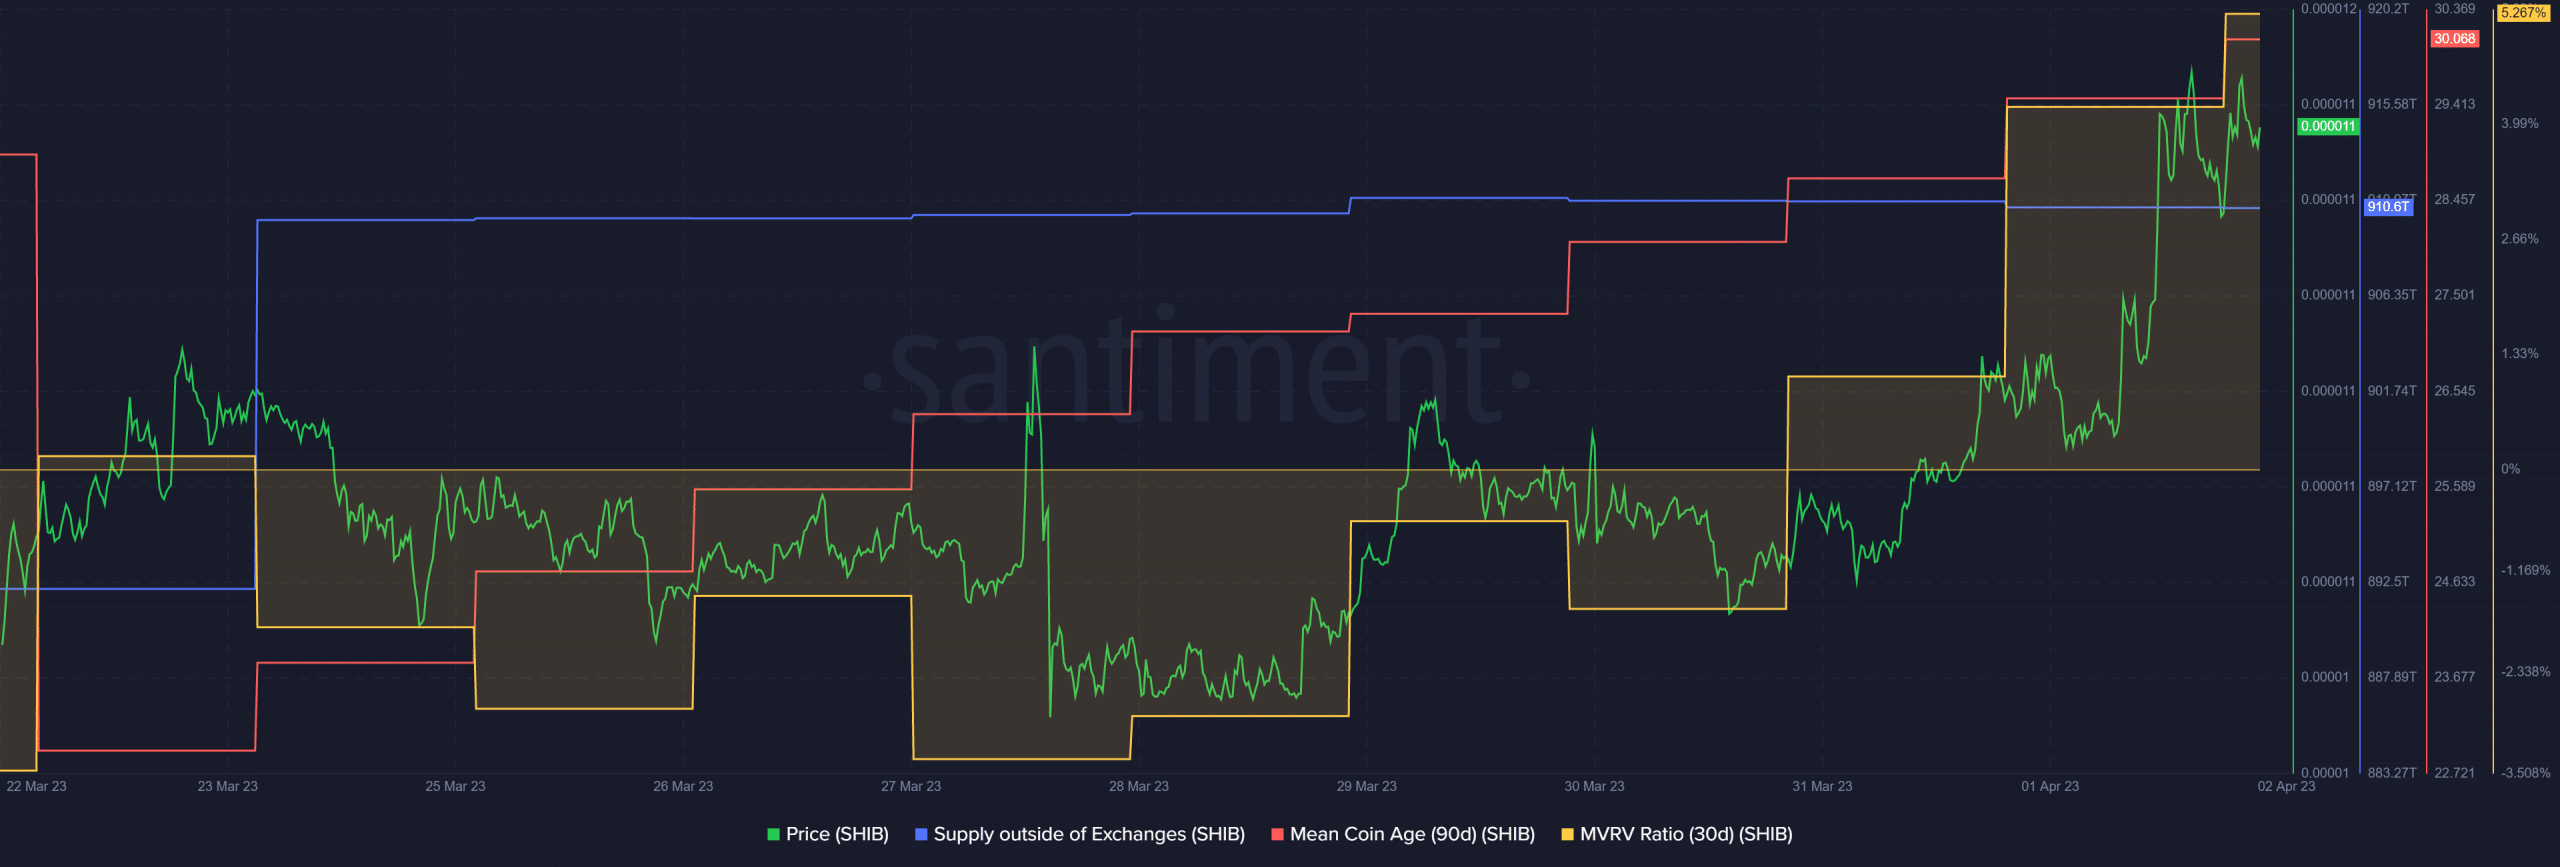
Source: Santiment
How much are
1,10,100 SHIBs worth today?According to Santiment, the 90-day Mean Coin Age slope rose, showing a wide accumulation of SHIB – evidence of a potential bullish rally. Similarly, monthly holders recovered past losses and saw a profit of 5% at press time.
However, the supply outside of exchanges dropped slightly, showing that the accumulation trend slowed. The trend could tip bears to enter the market, but investors should track BTC price action for more profitable moves.