
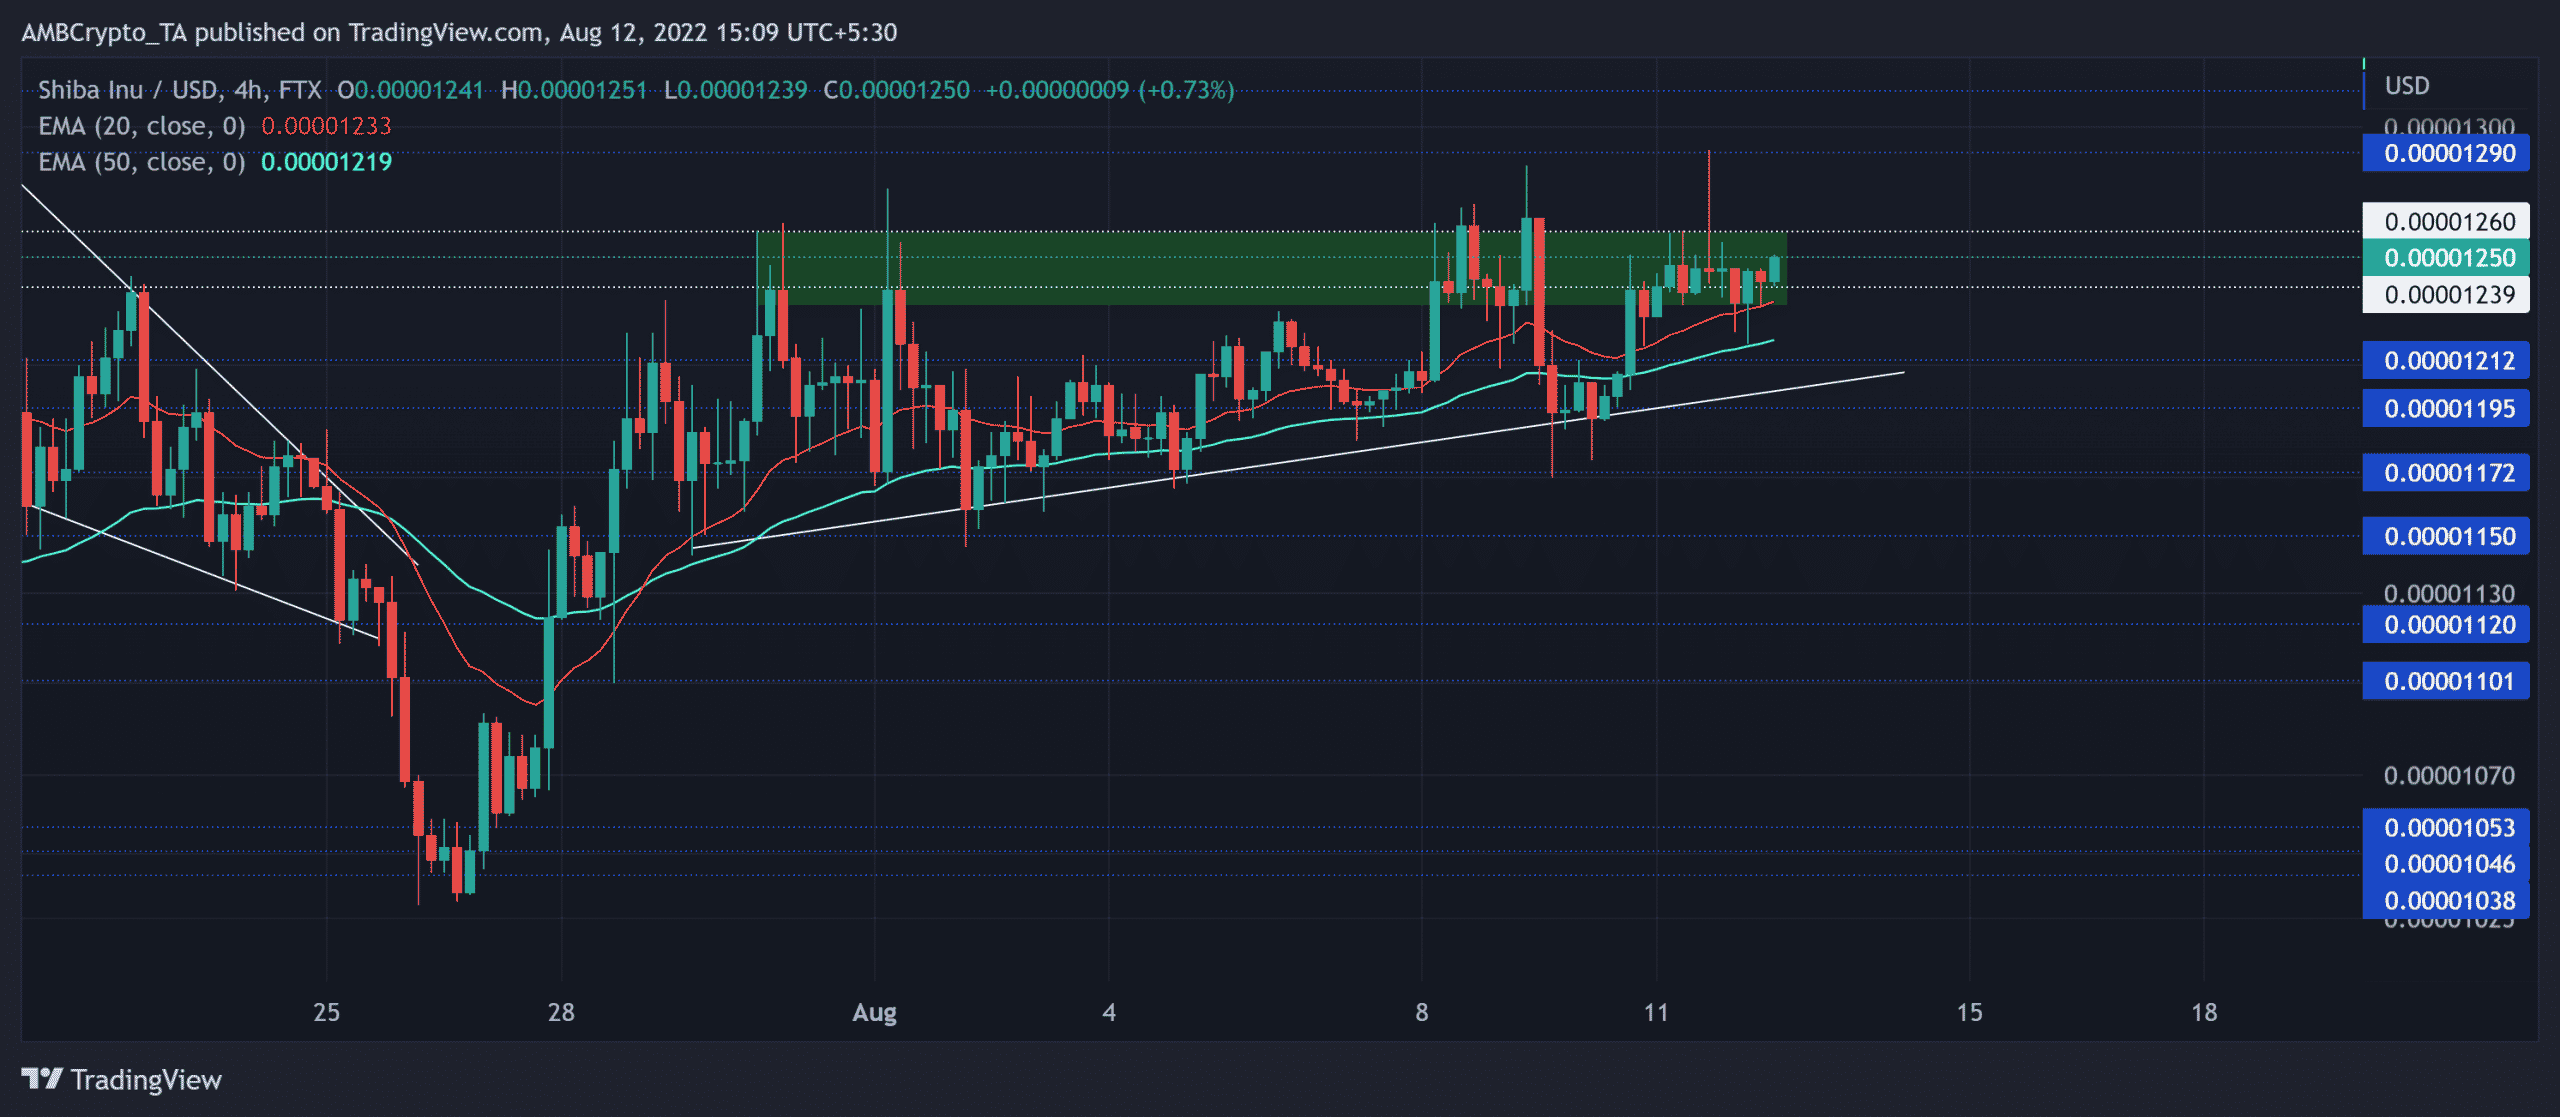
Shiba Inu [SHIB]’s journey over the last month has entailed a robust buying spree, as evidenced by its higher troughs. The meme coin rose saw a gradual rise but seemingly hit a plateau in the $0.01239-$0.0126 range. (For brevity, SHIB prices are multiplied by 1000 from here on).
While the price action established itself above the 20 EMA (red) and the 50 EMA (cyan), the bulls took charge of the immediate trend.
Should the buyers gather enough thrust to keep retesting the $0.0126-mark, the alt could see a bullish volatile break after the sluggish phase. At press time, SHIB traded at $0.0125.
SHIB 4-hour Chart
Source: TradingView, SHIB/USD
Over the past two weeks, the buyers faced recovery barriers in the immediate supply zone. Meanwhile, the bulls kept building up on their underlying pressure that came to fruition in the form of higher lows over the last few weeks.
The north looking 20 EMA (red) and the 50 (cyan) assumed immediate support post their recent bullish crossover. Also, with the price action sailing near the EMAs for a while, SHIB would aim to break its squeeze phase and break into high volatility in the coming times.
Over the last few days, SHIB formed an ascending triangle on the four-hour chart and reflected a visible bullish edge. Further, the volumes have been receding. Generally, the volumes are on a downtrend before a likely breakout in the case of ascending triangles.
An immediate close above the $0.0126-mark can affirm breakout chances. In this case, SHIB could witness an extended recovery toward the $0.0131-$0.0133 range. An inability to find a close above this mark would encourage the current slow-moving tendencies near the EMAs.
Rationale

The RSI has been gradually moving north over the last two days. The buyers must strive to breach the limits of the 59-level resistance to heighten the chances of continued recovery.
Also, the Accumulation/Distribution indicator’s lower troughs bullishly diverged with the price action over the past three days. To top it up, the DMI too resonated with the bull power. However, the altcoin’s directional trend [ADX] seemed substantially weak.
Conclusion
Given the bullish setup near the $0.0126 resistance, the buyers would aim to expedite their rally in the coming sessions. Any reversals from this resistance could hint at a continued dull phase. The targets would remain the same as discussed.
But the alt shares a whopping 88% 30-day correlation with Bitcoin. Hence, keeping an eye on Bitcoin’s movement with the overall market sentiment could be essential to identify any bullish invalidations.